Business Improvement and Social media
23.3K views | +0 today
Follow
Your new post is loading...
Scooped by Ricard Lloria
Scoop.it!

#Leadership Material: How To Up Your Game

#Leadership Material: How To Up Your Game | Business Improvement and Social media | Scoop.it
Leadership is about making others better as a result of your presence and making sure that impact lasts in your absence. In other words, if you’re not making a positive, lasting difference, you’re not really a leader. Here's a new book that offers some fresh insight into an ageless subject.
Begoña Pabón's curator insight, May 9, 2017 4:24 AM
Un lider es aquel cuya presencia y acciones provoca que otros sean aun mejores... tanto si está presente como si no lo está. Y este objetivo es con frecuencia, la suma de pequeños detalles mantenidos en el tiempo.
Rescooped by Ricard Lloria from visualizing social media
Scoop.it!

Social Media Around the World: A Complete Infographic Guide

Social Media Around the World: A Complete Infographic Guide | Business Improvement and Social media | Scoop.it

The world of social media is increasing and has a powerful role to play in the future.

In 2012, more than 63% of online users visited more number of social media websites than any other types, and that number is expected to continue going up through 2013.

View this infographic to find more statistics about online behavior and the use of Facebook, Twitter, LinkedIn, YouTube, Pinterest and Instagram across the globe...


Via Lauren Moss
Angie Mc's curator insight, January 26, 2014 10:13 AM

Making friends worldwide is one of the best parts of participating in social media.  I especially love how Twitter makes it easy to connect across time zones.

Lydia Gracia's curator insight, February 14, 2014 5:20 AM

La Guia completa del Social Media en el Mundo

Professor Jill Jameson's curator insight, March 4, 2014 10:52 AM

Astonishing figures! 

Rescooped by Ricard Lloria from visualizing social media
Scoop.it!

How Are We Using Social Media? [INFOGRAPHIC]

How Are We Using Social Media? [INFOGRAPHIC] | Business Improvement and Social media | Scoop.it

Did you know that between 2011 and 2012, time spent on social media increased by some 30 billion minutes, representing a year-on-year increase of 37 percent?

But, according to one study, while Facebook, Twitter and Pinterest remain popular with users aged 30 and over, it’s the formerly niche social platforms such as Reddit, Github and DeviantArt that can boast the highest representation amongst the important 18-29 demographic.


Digital agency iAcquire partnered with SurveyMonkey to track the behaviour of social media users, presenting their key findings in this infographic...


Via Lauren Moss
Bart van Maanen's curator insight, April 5, 2013 6:19 AM

Niet echt verrassend trends, maar goed om even te zien. En gebaseerd op op Amerikaans onderzoek, want ik geloof niet dat Reddit, Github and DeviantArt veel in NL gebruikt worden.

Rescooped by Ricard Lloria from visualizing social media
Scoop.it!

What & Why People Share On #SocialMedia (#Infographic)

What & Why People Share On #SocialMedia (#Infographic) | Business Improvement and Social media | Scoop.it

What people are sharing and how they’re sharing it is changing fast. A new infographic from Go-Gulf, a web design team based in Dubai, has gathered the latest data, which is now available in this newly released (July 2014) social media infographic. Here are the highlights…


Via Lauren Moss
Raihan Roney's curator insight, September 23, 2014 12:51 AM
Raihan Roney
Rachel Turner Dool's curator insight, October 26, 2014 6:47 AM

Wow! what a list of stats. Some really interesting ones here...

CONETZAR's curator insight, October 30, 2014 6:21 AM

¿Alguna vez te has preguntad qué comparte la gente en las redes sociales? Y, ¿por qué lo comparte?

Esta interesante y completa infografía muestra los elementos más compartidos en las redes sociales durante el año 2013. Estos van desde vídeos hasta opiniones o noticias.

También se analiza lo compartido en las diferentes redes sociales y por qué se eligen esos medios para compartirlo.

Por último, es posible conocer los datos demográficos de los usuarios de redes sociales.


Para terminar... un dato curioso: Según este estudio, el país en el que más contenido se comparte a través de las redes sociales es Turquía, con un 93 %. 

Rescooped by Ricard Lloria from visualizing social media
Scoop.it!

The Second Screen Phenomena – Infographic

The Second Screen Phenomena – Infographic | Business Improvement and Social media | Scoop.it

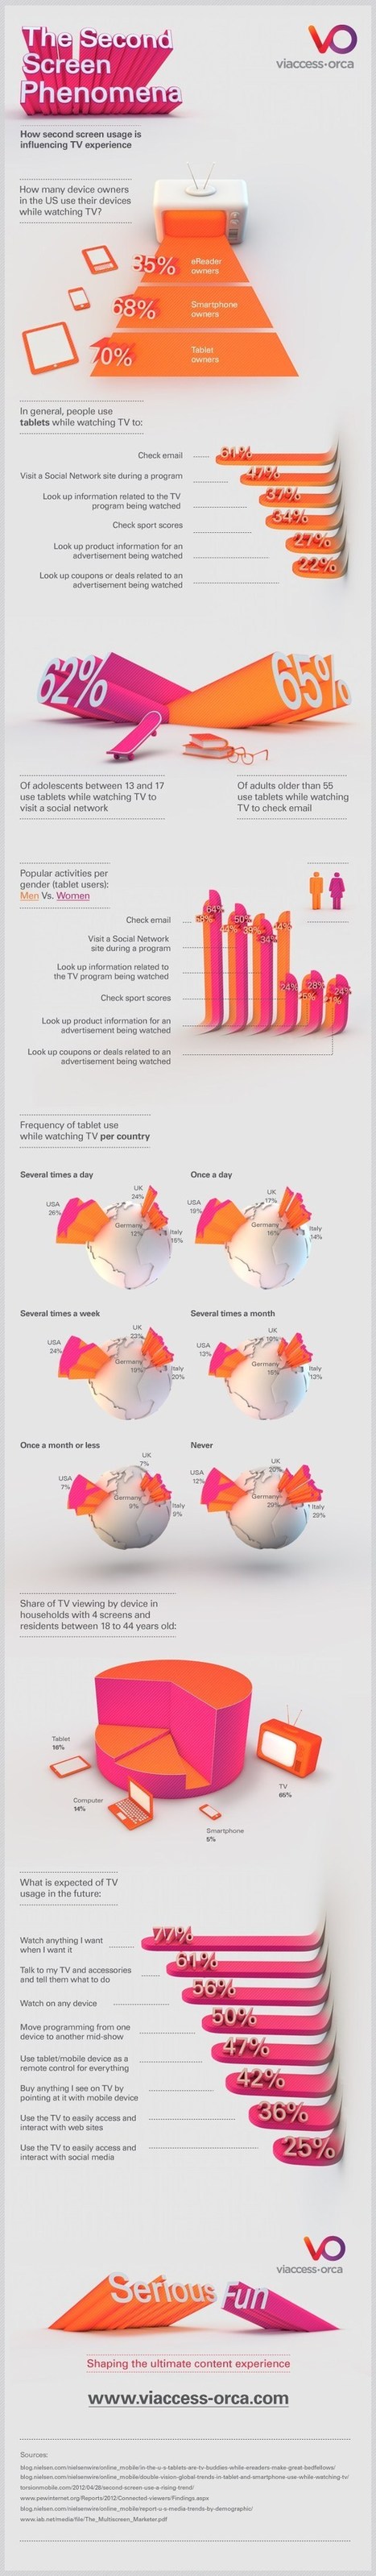
Second screen viewing, which refers to using an additional electronic device while watching television, is a widespread consumer behavior that has quickly become the norm.


In an attempt to better understand this trend, Viaccess-Orca has analyzed second screen usage amongst diverse populations of television viewers. The results, which appear in this infographic, demonstrate the extent to which second screen viewing is altering the TV industry. According to our data, 70% of tablet owners, and 68% of smartphone owners, state that they use their additional devices while watching TV.

However, only 37% of those who practice second screen viewing do so in order to look up information that is related to the program they are watching. Most TV viewers use their devices in order to check emails or visit a social network...


Via Lauren Moss
Rescooped by Ricard Lloria from visualizing social media
Scoop.it!

The Social Sickness - INFOGRAPHIC

The Social Sickness - INFOGRAPHIC | Business Improvement and Social media | Scoop.it

The Internet has become the building block of information creation and storage in the modern age. It’s a place where we can create websites, publications, blogs, and micro-blogs; then transfer that knowledge to people across the globe.

Social media has become one of the greatest harnessers of this technology and provides us with a multitude of platforms in which to engage and share content. With all of this social media bliss distracting us, sickness has also come knocking.
We have surrendered to the temptation to check our phones every two minutes to see how many likes our Instagram photos have, how many retweets our Twitter account got, and who commented on our Facebook posts...
The characters portrayed in this infographic bring us face-to-face with these tendencies, and shed insight into the types of personalties affected. Whether you’re an unabashed alert-lover, verb creator, or someone who would rather use the “like” button than ever fully engage with your friends ever again — there’s a 'social media sickness' for you.


Via Lauren Moss
No comment yet.