Business Improvement and Social media
23.3K views | +0 today
Follow
Your new post is loading...
Rescooped by Ricard Lloria from visualizing social media
Scoop.it!

What & Why People Share On #SocialMedia (#Infographic)

What & Why People Share On #SocialMedia (#Infographic) | Business Improvement and Social media | Scoop.it

What people are sharing and how they’re sharing it is changing fast. A new infographic from Go-Gulf, a web design team based in Dubai, has gathered the latest data, which is now available in this newly released (July 2014) social media infographic. Here are the highlights…


Via Lauren Moss
Raihan Roney's curator insight, September 23, 2014 12:51 AM
Raihan Roney
Rachel Turner Dool's curator insight, October 26, 2014 6:47 AM

Wow! what a list of stats. Some really interesting ones here...

CONETZAR's curator insight, October 30, 2014 6:21 AM

¿Alguna vez te has preguntad qué comparte la gente en las redes sociales? Y, ¿por qué lo comparte?

Esta interesante y completa infografía muestra los elementos más compartidos en las redes sociales durante el año 2013. Estos van desde vídeos hasta opiniones o noticias.

También se analiza lo compartido en las diferentes redes sociales y por qué se eligen esos medios para compartirlo.

Por último, es posible conocer los datos demográficos de los usuarios de redes sociales.


Para terminar... un dato curioso: Según este estudio, el país en el que más contenido se comparte a través de las redes sociales es Turquía, con un 93 %. 

Rescooped by Ricard Lloria from visualizing social media
Scoop.it!

#Social Media Best Practices for #Infographics

#Social Media Best Practices for #Infographics | Business Improvement and Social media | Scoop.it

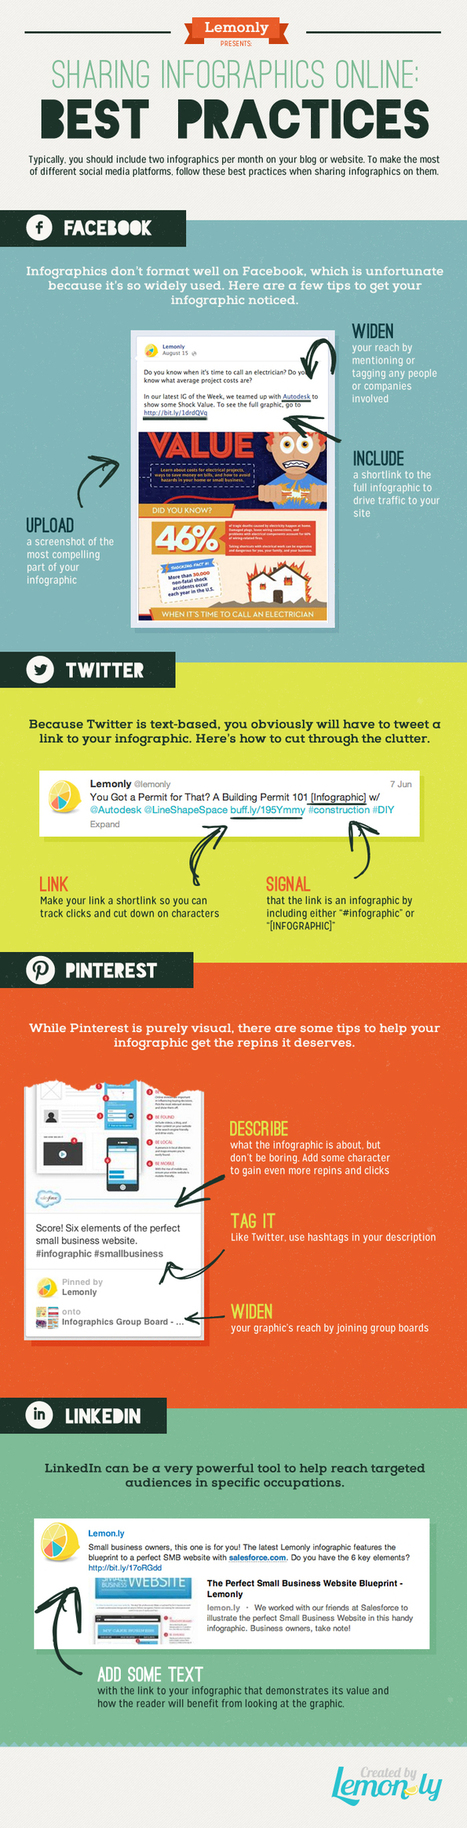
Sharing your infographic that’s hosted on your website/blog and engaging the social sharing potential is key to maximizing the work you put in to creating your infographics.  

Each social network has different image display requirements.

For example, tall infographics do not present well on Facebook. Facebook outlines horizontal images and a ratio of 1200 w x 627 h, meaning you may need to create some sharing images to drive social viewers to the main infographic.


The team at Lemonly put together a great infographic covering keys for social sharing on:

FacebookTwitterPinterestLinkedIn

Have a look and bookmark for future reference...


Via Lauren Moss
Jeff Domansky's curator insight, September 1, 2014 11:33 PM

Helpful infographics reference and great tips for social media utilization.

Jeff Domansky's curator insight, September 1, 2014 11:35 PM

Helpful infographics reference and great tips for social media utilization.

ManufacturingStories's curator insight, October 9, 2014 9:30 AM

For more resources on Social Media & Content Curation visit http://bit.ly/1640Tbl

Rescooped by Ricard Lloria from visualizing social media
Scoop.it!

The Formula Behind Facebook Engagement [infographic]

The Formula Behind Facebook Engagement [infographic] | Business Improvement and Social media | Scoop.it

A constant challenge for Internet marketers targeting Facebook has been gaining engagement. Generally brands and page admins have defined engagement as things such as likes, shares, and comments, but more importantly to gain reputation with Facebook’s algorithm.

This infographic created by SocialMouths and American Express OPEN illustrates ways to help make a Facebook page’s post a bit more popular through optimization of post elements such as short posts, the use of emoticons, the best times to post, and contest ideas...


Via Lauren Moss
No comment yet.
Rescooped by Ricard Lloria from visualizing social media
Scoop.it!

6 Myths of #Social Sharing ( #infographic) #sm #socialmedia

6 Myths of #Social Sharing ( #infographic) #sm #socialmedia | Business Improvement and Social media | Scoop.it

#

Social sharing buttons on websites account for less than 30 percent of all sharing, and links shared on Thursday get peak engagement and the longest-lasting traffic.

Those are only two of the results of a RadiumOne study focusing on sharing behavior. RadiumOne is an enterprise advertising platform that operates the Po.st social sharing and URL-shortening platform — which naturally generates a lot of data on what people share, how they share, and what kind of sharing is the most effective.


More information at the link...


Via Lauren Moss
Barbara Robinson's curator insight, June 6, 2014 10:03 AM

Myth vs. Facts...Be Real.

Nine0Media's curator insight, June 7, 2014 2:45 PM

#DIYSEO #SocialMediaTools 

successmakers's curator insight, September 5, 2014 1:20 PM

I have seen this in action and found it to be true and a good representation.

Rescooped by Ricard Lloria from visualizing social media
Scoop.it!

Best Time For Sharing Content [Infographic]

Best Time For Sharing Content [Infographic] | Business Improvement and Social media | Scoop.it

Many top marketers experiment with their content sharing approach to find the best time to send posts to Twitter, Facebook, and other social networking sites. You have to try this for your own content to find the right time.


Via Lauren Moss
River Cliff Homes 's curator insight, December 30, 2013 9:13 AM

Interesting infographic on content sharing! What do find has been your best/worse to share content by device?

Heather Koroll's curator insight, March 19, 2014 9:26 PM

add your insight...

 
Michelle Gilstrap's curator insight, March 24, 2014 12:26 PM

Knowing when to share is always a good idea. Check out this infographic.