Business Improvement and Social media
23.3K views | +0 today
Follow
Your new post is loading...
Rescooped by Ricard Lloria from visualizing social media
Scoop.it!

What Happens in One Minute on the Internet? [#Infographic]

What Happens in One Minute on the Internet? [#Infographic] | Business Improvement and Social media | Scoop.it
As millions of new Internet users log on every month, the numbers relating to the flow of information becomes ever more staggering.


An infographic from analytics software provider Domo, attempts to quantify just how much data is generated in one minute online.

Compare it to Domo’s similar infographic from two years ago to see just how much more we’ve crammed into a minute...


Via Lauren Moss
Jacques Morin's curator insight, April 24, 2015 9:57 AM

Wow, ça bouge sur internet en une minute!!!

Mike Allen's curator insight, April 25, 2015 5:54 AM

different psychology attracts different users - obvious - but finding out details will energise your response rate. One ad won't do for all

Thomas Sowell's curator insight, October 12, 2016 8:31 PM
It is amazing what information is out there on the internet.
Rescooped by Ricard Lloria from visualizing social media
Scoop.it!

Infographic: The Incredible Growth of Web Usage [1984-2013]

Infographic: The Incredible Growth of Web Usage [1984-2013] | Business Improvement and Social media | Scoop.it

In the three decades since the Internet evolved from an experimental band of academic and government computer systems into a globe-spanning network of interconnected systems, the amount of time spent online has grown to rival (or even exceed) the time spent living offline. Personal computers, tablets and smartphones have made the connected life a reality, and the number of folks pursuing it has exploded.


Find more details at the link.


Via Lauren Moss
Andrew Earnshaw's curator insight, September 20, 2013 3:23 PM

Yes, I too can remember when there wasn't an Internet. Is there an application that's not yet been produced. What next will we all wonder how we did without ?

Al Marqz's curator insight, September 27, 2013 7:14 PM

La humanidad en bloque ha optado por la gran Red y de ésta, por las redes sociales... ¡Larga vida a la web!

Pallab Kakoti's curator insight, April 16, 2014 7:44 AM

The rise & rise of web usage is one of the most unifying & reformative development to have impacted on a global scale. An insightful info-graphic that offers a unique purview from the inception days of internet to the latest trend of app usage estimating an annual revenue of $24 billion.


A pure delight that's not to be missed #PlbKkt for #hshdsh via #blogs4bytes //

Rescooped by Ricard Lloria from visualizing social media
Scoop.it!

4 Big Social Media Lessons from Small Businesses [INFOGRAPHIC]

4 Big Social Media Lessons from Small Businesses [INFOGRAPHIC] | Business Improvement and Social media | Scoop.it

Social Media is not just a method only being utilized by big brands anymore. Small businesses are starting to embrace and implement social techniques on a grander scale.


A 2012 SMB Group Study found that 20% of small businesses use social in an ad hoc, informal way- to generate leads and drive traffic to websites. The study also revealed that 24% of small businesses are using social in strategic and structured way, including data analysis of market trends and customer driven product ideas.


The businesses practicing strategic social media enjoyed a higher level of integration amongst their departments. The largest disparity between the two groups was uncovered in Customer Service. Only 8% of the companies with an informal social media environment had integrated into Customer Service, while an impressive 43% of the strategic social group integrated Customer Service.

That's quite a difference and food for though if your small business just kicking the tire with little or no social presence.


Via Lauren Moss
No comment yet.
Rescooped by Ricard Lloria from visualizing social media
Scoop.it!

2014: The Numbers Behind Social Media [infographic]

2014: The Numbers Behind Social Media [infographic] | Business Improvement and Social media | Scoop.it
Whether you use them for reaching potential customers, interact with people, or to generate content, Social Media is a power tool for businesses. Check out some of the most popular online networks and how much of an impact they each have.

Via Lauren Moss
Charles Rein's curator insight, March 13, 2014 11:36 AM

Set it and Forget it, social media works

Graig Angarella's curator insight, March 24, 2014 1:14 AM

I found many of the statistics in this article to be very intriguing.  For starters, I did not realize that Twitter's follower base has now grown to over half that of Facebook's.  Furthermore, I had no idea that users spend close to the same amount of time on each site, because to me, Twitter is more of a place to simply post things, while Facebook is more of a place to browse.  Next, I was not surprised to hear that about 80% of Pinterest users are women, however, I was surprised when it stated that about half of the total number of users have children!  Last but not least, I personally have not heard much chatter about Google+, so it was surprising to find out that its follower count increases by about 33% each year!  All in all, it was a very interesting article to read through!

Daniel Vince's curator insight, March 24, 2014 2:30 PM

Another interesting infographic showing the potential and scale of social media.

Rescooped by Ricard Lloria from visualizing social media
Scoop.it!

The Future of Mobility [Infographic]

The Future of Mobility [Infographic] | Business Improvement and Social media | Scoop.it

An astounding 80 percent of the world’s population now has a mobile phone—and 84 percent is unwilling to go a single day without their phone. About 45 percent of Americans say they can’t go more than a few hours without checking their phones. In 2012 there were five billion mobile phones in the world—1.8 billion of these were smart phones.


Facebook now reaches 76 percent of the smartphone market, and it accounts for 23 percent of total time spent using apps each month.

The next five most used applications are Google apps, and they account for 10 percent of app usage time. One of the latest smartphone trends is that things are getting less touchy but more sensitive. Gestures and other non-tap inputs are on the rise. Casting a sidelong glance, for example, can pause a video. Some apps are being developed that will switch from manual to voice to text to gesture, depending on what you are doing...


Via Lauren Moss
Rein Hof's curator insight, July 8, 2013 12:19 PM

Voor een ieder die zich nog afvraagt waarom mobile content belangrijk is.. 

Mobile is dé manier om in cotact te blijven. En of je nu een commercieel bedrijf bent wat graag een product aan de man brengt, of je bent dienstverlener of overheid. Het maakt niet meer uit. Geen mobile ontent, geen engagement. Niet meer boeien en binden. Tja.. Wie kan zich dat nu nog permiteren? 

sophiedesc's curator insight, July 19, 2013 7:21 AM

Mobile Commerce: 


> "Mobile Shopping accounted for 11% of e-commerce in the 4th quarter of 2012 (up from 3% 2 years earlier)."

> Roughly 58% of smartphone users have made purchases on their smartphones.

> These Mobile Shoppers typically use smartphones for 50 to 60% of the Shopping."

Katie Muirhead's curator insight, August 20, 2014 12:17 PM

Seeking to manage our attention and avoid distraction is one thing, but first we need to be aware of where our attention is going. As smartphones are increasingly used, this infographic highlights in just what way we use our phones. 1 in 5 people check their phone every ten minutes... something tells me that the smartphone may be one of the biggest sources of modern distraction!

Rescooped by Ricard Lloria from visualizing social media
Scoop.it!

The Second Screen Phenomena – Infographic

The Second Screen Phenomena – Infographic | Business Improvement and Social media | Scoop.it

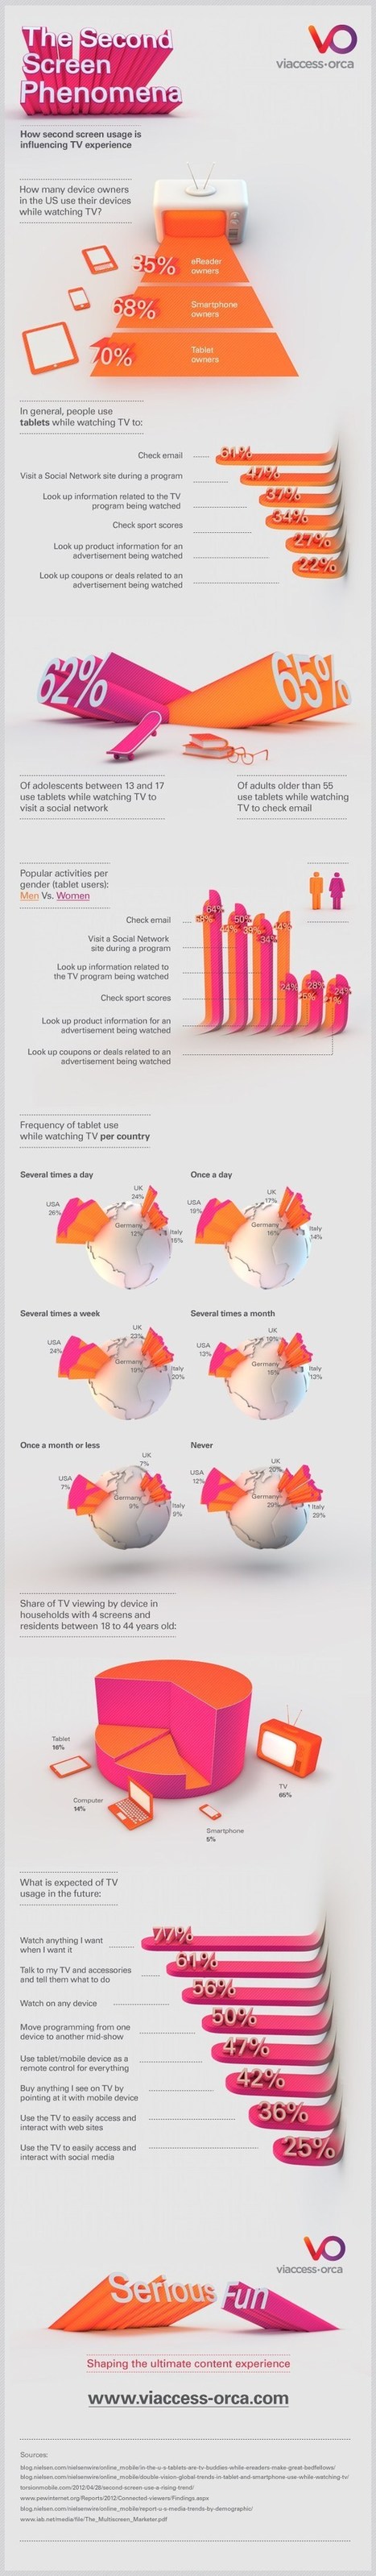
Second screen viewing, which refers to using an additional electronic device while watching television, is a widespread consumer behavior that has quickly become the norm.


In an attempt to better understand this trend, Viaccess-Orca has analyzed second screen usage amongst diverse populations of television viewers. The results, which appear in this infographic, demonstrate the extent to which second screen viewing is altering the TV industry. According to our data, 70% of tablet owners, and 68% of smartphone owners, state that they use their additional devices while watching TV.

However, only 37% of those who practice second screen viewing do so in order to look up information that is related to the program they are watching. Most TV viewers use their devices in order to check emails or visit a social network...


Via Lauren Moss