

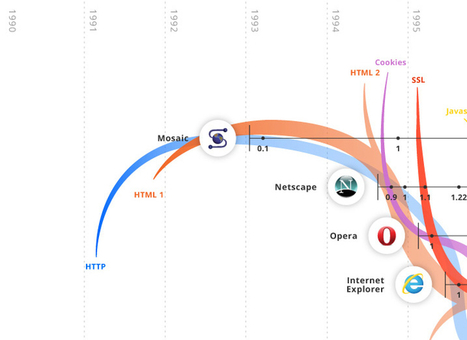
"Interactive infographic about the evolution of browsers and the web ..."
Get Started for FREE
Sign up with Facebook Sign up with X
I don't have a Facebook or a X account


 Your new post is loading...
 Your new post is loading...
Your new post is loading...
"Interactive infographic about the evolution of browsers and the web ..." 
No comment yet.
Sign up to comment

From
tech

"Since they first appeared in science fiction decades ago, engineers have long played with the idea of holograms. The technology required has only been ..."
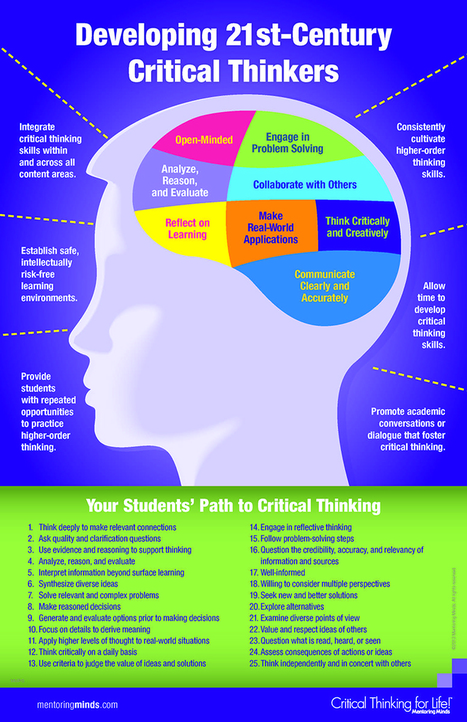
"View or download an 11x17 version of the "Developing 21st Century Critical Thinkers" Infographic by Mentoring Minds ..."

"The Teacher's Google Toolkit Infographic presents the Google tools that every teacher should try out. Some are very well known, others less so, but there are great ways to use all of them in the classroom ..."

"This infographic outlines the learning theory pioneered by George Siemens and Stephen Downes ..." Via Beth Dichter

Beth Dichter's curator insight,
November 16, 2014 7:39 PM
Have you wondered what connectivism is? This infographic, using information from Stephen Downes and George Siemens provides this definition for connectivism: "...the thesis that knowledge is distributed across a network of connections, and therefore that learning consists of the ability to connect and traverse those networks." What are the 8 principles? They are listed below but you will find much more information in the infographic. 1. Learning and knowledge rest in a diversity of opinions 2. Learning is the process of connecting specialized nodes 3. Learning may reside in non-human appliances 4. Capacity to know is more important than what is currently known 5. Nurturing and maintaining connections is needed to facilitate continual learning 6. The ability to define connections between concepts is important 7. Currency (accurate, up-to-date knowledge) is the intent of all connectivist learning activities 8. Decision-making is a learning process as information can change and what is viewed as correct one day may be incorrect the next The second part of this infographic focuses on What Does an Online Connectist Course Look Like? There is much information to be found in this lengthy infographic. It also includes a list of works consulted.
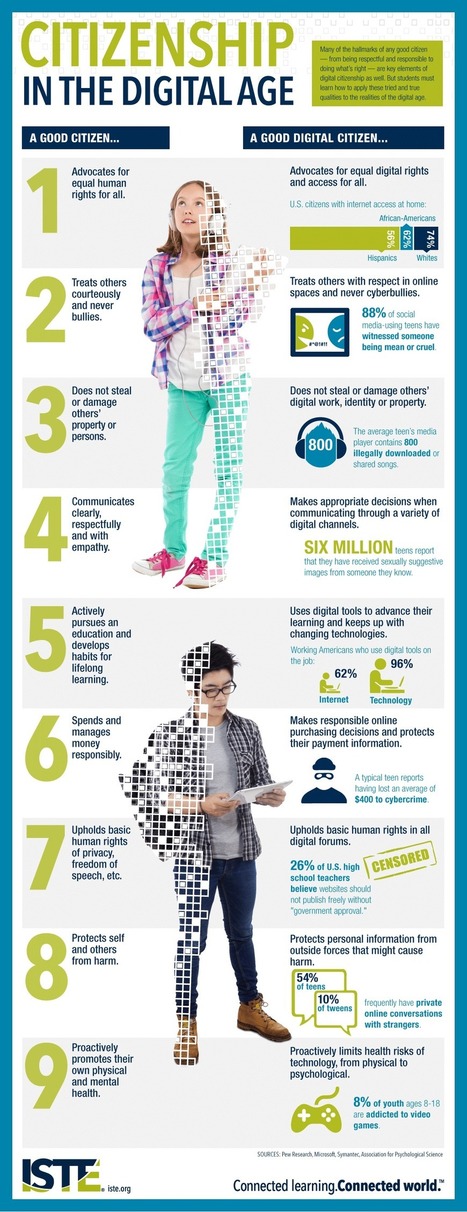
"Digital citizenship is not so different from traditional citizenship. We still need to guide students to be kind, respectful and responsible. What’s new is teaching them how to apply these values to the realities of the digital age ..." Via Beth Dichter
Beth Dichter's curator insight,
November 6, 2014 7:37 AM
This new infographic from ISTE compares a good citizen to a good digital citizen. Many students many find this poster of value as they learn the need to be a good citizen both online and offline. As the post states, being a good citizen and a good digital citizen "are not so different from the basic tenets of traditional citizenship: Be kind, respectful and responsible, and just do the right thing." 
Lon Woodbury's curator insight,
November 10, 2014 3:36 PM
We still have a long ways to go to figure out how to make this happen as effectively as we do face to face interactions. -Lon

"The People of Pedagogy Infographic celebrates the contributions six researchers and educational theorists had on our understanding of pedagogy ..." ©

"According to a new infographic online courses provide many new advantages that are propelling online learning ..."
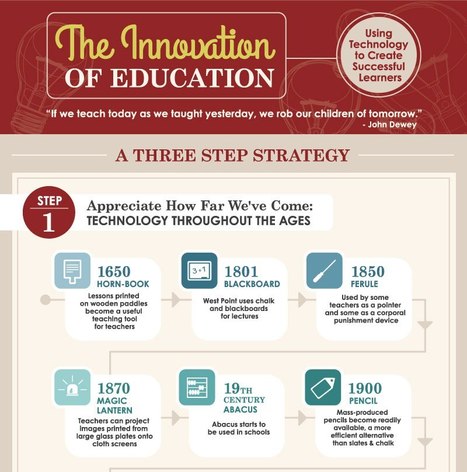
"The Innovation of Education Infographic covers educational advances over the past hundred years ..."

Isabella Rivas's curator insight,
May 25, 1:48 PM
I like that the article teaches us not to be afraid of change and never stop learning new research and concepts. We want to be innovators for our students by providing game-based learning and having a flipped classroom in the future. I hadn't realized what kind of technology resources were available back in the day, until I saw the infographic.
![[Infographic] How has the Internet changed education? - EdTechReview™ (ETR) | Creative teaching and learning | Scoop.it](https://img.scoop.it/w_4G9OI7HZeflxe_bFGTNTl72eJkfbmt4t8yenImKBVvK0kTmF0xjctABnaLJIm9)
"Internet that started as a discovery to view and share some private files over an organization has now spread its wings to all over the world. Now we use the internet for practically everything. And it has resulted into great positive changes in education ..."

"Because of the proliferation of new technologies, the younger generation today is outgrowing traditional forms of education ..."
|

"The Google Search Tricks Infographic provides a handy guide for 13 of the most useful shortcuts you can use to make your search experience more efficient ..."

"Gamification has serious implications for college students—and perhaps it’s time higher education got serious about implementing game design ..."
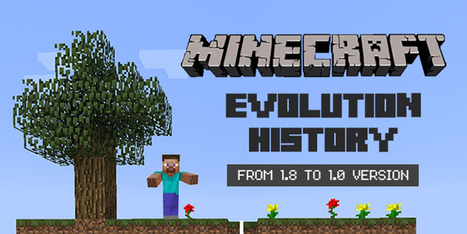
"In the world of software, age is not usually represented by how old the code is in years, but rather by version number. Numbers below 1.0 typically represent software before it's big release. Jumps in front of the decimal place -- 2.0, 3.30 and so on -- usually represent a large change to the software ..."

"Conveying information in a striking, concise way has never been more important, and infographics are the perfect pedagogical tool with which to do so. Below, you’ll find my experience with designing an infographic-friendly classroom research project, explained in a step-by-step process you can implement in your own classroom ..."

Alison DeBoe's curator insight,
November 22, 2014 5:29 PM
This takes a step by step process of how to make a research project into a infographic. It shows pictures and explains how it happens. I'm excited to see how it works!
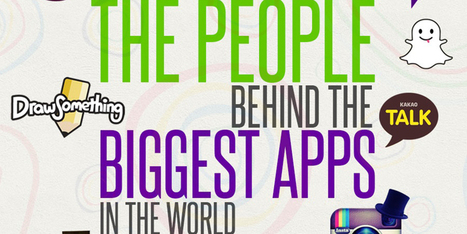
"We use applications almost every day for all kinds of things. We use social apps for communicating, games for passing time, to-do lists to keep us on task, and so on. Most of the hugely successful applications are owned by some large company, but at some point, they started with an individual who had ..."

"Infographics are a visual representation of data. When students create infographics, they are using information, visual, and technology literacies. This page includes links to help you develop ..." Via Amy Burns

Amy Burns's curator insight,
November 16, 2014 3:04 PM
Amazing collection of research, resources and examples for inforgraphics. 
PitchWorx's comment,
November 18, 2014 6:04 AM
Absolutely correct! As we’re an infographic design company, we totally agree with you. Creating Infographic, it helps to communicate effectively with the target audience. They help brands communicate in a more powerful manner!

The Rice Process's curator insight,
November 18, 2014 9:40 AM
I find infographics an effective way to present information and data. Because infographics use a combination of images, words, and numbers, it effectively communicates the content both verbally and visually. Learning concepts and relationships can easily be conveyed through a well-designed infographic. Infographics tap the verbal senses through words, phrases, sentences, and captions; and the images and graphic representations bombarded the visual senses. Consequently, infographics present the greatest opportunity to increase the effectiveness of what is being taught.
Designing visual representation of information is more than translating words to pictorials. The construction involves filtering the information, drawing relationships, revealing patterns and representing the information as meaningful content.

"Innovative design crosses over all aspects of education. The American Society for Innovation Design in Education, or ASIDE, seeks to infuse curriculum with new approaches to teaching and thinking ..." Via Beth Dichter

Paul Macmullen's curator insight,
October 21, 2014 6:32 PM
Useful reference for a graphically challenges creature of language such as myself :-)

Ness Crouch's curator insight,
July 2, 2015 10:20 PM
Visual and linear learning design should come together to create a learning tool. Infographics are an example of this.

"Impressive Infographics of Higher Education Roadmap of my colleague, Piet van der Zanden ..."
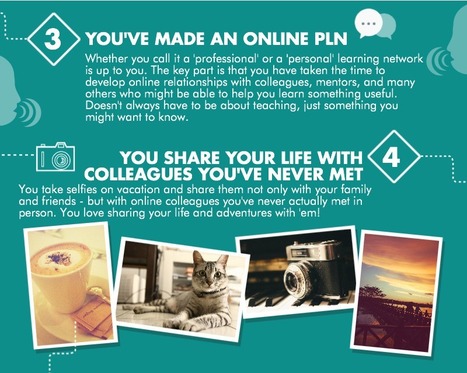
"The 10 Signs You Are a Tech-Savvy Teacher Infographic helps you find out just how much technology has become integrated with your teaching life ..."
![Using YouTube as a time machine for your classroom [#Infographic] | Creative teaching and learning | Scoop.it](https://img.scoop.it/zA4J89fS9TSclvIEdFCgNjl72eJkfbmt4t8yenImKBVvK0kTmF0xjctABnaLJIm9)
"Planning a lesson around YouTube just got easier and more fun ..."
Isabella Rivas's curator insight,
May 25, 1:58 PM
Young students these days like to see videos that have to do with the concepts the teacher is teaching. While YouTube has grown so much over the last decade, there's a lot of educational YouTube channels that can go along with the curriculum and students can gain interest from. Teachers can just type in the name of the topic lesson and they can find many options for them to choose from for the upcoming lesson.

"The Why Teachers Should Use Rubrics Infographic shows how providing detailed explanations of an assignment using a rubric can assist students in both completing tasks and improving future performance and suggests various ways teachers can use ..."
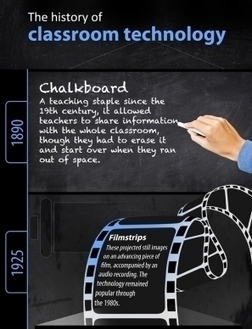
"Advances in technology have definitely revolutionized the educational world—especially in recent decades ..."
|


![e-learning, conocimiento en red: A history of open educational resources [infographic] [infografía] | Creative teaching and learning | Scoop.it](https://img.scoop.it/qitYuV_q29WPZ0HUKQo16jl72eJkfbmt4t8yenImKBVvK0kTmF0xjctABnaLJIm9)

![What type of learner are you [INFOGRAPHIC] #lea... | Creative teaching and learning | Scoop.it](https://img.scoop.it/WwKgyW4aieto28D-KpuNijl72eJkfbmt4t8yenImKBVvK0kTmF0xjctABnaLJIm9)


Up till 2012.