E-Learning-Inclusivo (Mashup)
1.1M views | +4 today
Follow
E-Learning-Inclusivo (Mashup)
Aprendizaje con TIC basado en los aprendices.
Curated by juandoming
Your new post is loading...
Rescooped by juandoming from Digital Learning - beyond eLearning and Blended Learning
Scoop.it!

Top Actions to Achieve a Future of Unified Data Models in Higher Ed

Top Actions to Achieve a Future of Unified Data Models in Higher Ed | E-Learning-Inclusivo (Mashup) | Scoop.it
To help colleges and universities envision a better future of data analytics in higher education and provide practical steps to get there, Educause has released a new "Action Plan" for achieving unified data models across the institution.

Via Peter Mellow
No comment yet.
Rescooped by juandoming from E-Learning and Technology
Scoop.it!

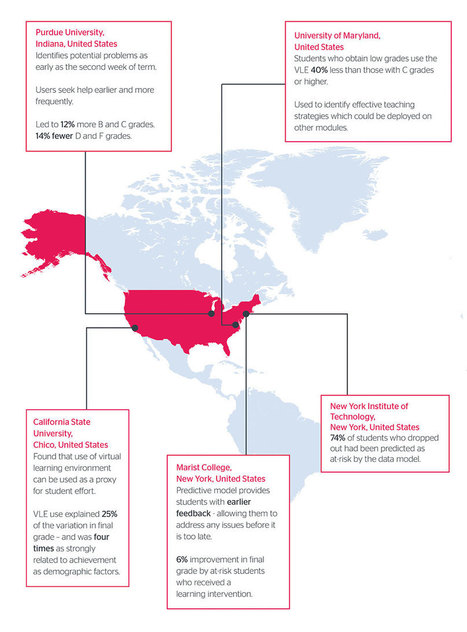
Learning analytics in higher education | Jisc

Learning analytics in higher education | Jisc | E-Learning-Inclusivo (Mashup) | Scoop.it
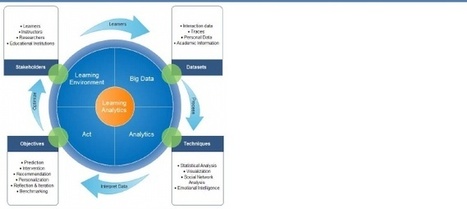
A review of UK and international practice. Read our updated briefing on learning analytics and student success from January 2017 (pdf).

Via Mark Rollins
No comment yet.
Rescooped by juandoming from Innovative Learning Spheres
Scoop.it!

The Unpredictability of Predictive Analytics 2.0

The Unpredictability of Predictive Analytics 2.0 | E-Learning-Inclusivo (Mashup) | Scoop.it
How are the tools and practices of predictive analytics being used, how can they be better used, and how can institutions understand their own progress with analytics?

Via Peter Mellow, Sabrina M. BUDEL
No comment yet.
Scooped by juandoming
Scoop.it!

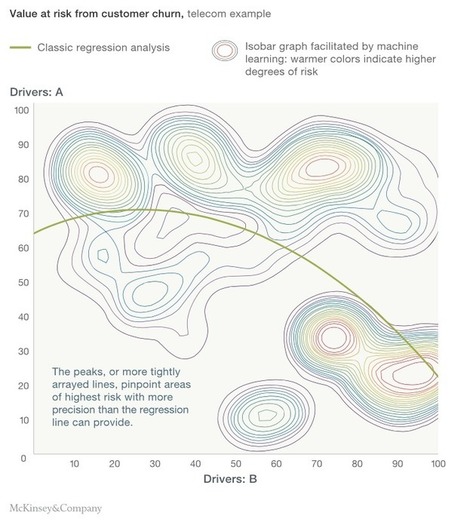
Difference between Machine Learning & Statistical Modeling

Difference between Machine Learning & Statistical Modeling | E-Learning-Inclusivo (Mashup) | Scoop.it
This article explains in brief the differences between Machine Learning & Statistical modeling including the algorithms, required efforts, output & a case study.
No comment yet.
Rescooped by juandoming from Creative teaching and learning
Scoop.it!

Professors should seize chance to use data to improve learning (essay) - Inside Higher Ed

Professors should seize chance to use data to improve learning (essay) - Inside Higher Ed | E-Learning-Inclusivo (Mashup) | Scoop.it

"Decision making was slow: managers relied on manual sales tallies, compiled weekly or annually ..."

©


Via Leona Ungerer
No comment yet.
Scooped by juandoming
Scoop.it!

OPINION: Who Needs Learning Relationship Management? We All Do

OPINION: Who Needs Learning Relationship Management? We All Do | E-Learning-Inclusivo (Mashup) | Scoop.it
People really can’t learn well without relationships. Sure, they can process information and take standardized tests, but a mind by itself can only answer its own questions and is rarely, if ever, inspired.


Even four-year-olds get the importance of people to learning. When you ask them what
No comment yet.
Rescooped by juandoming from e-Xploration
Scoop.it!

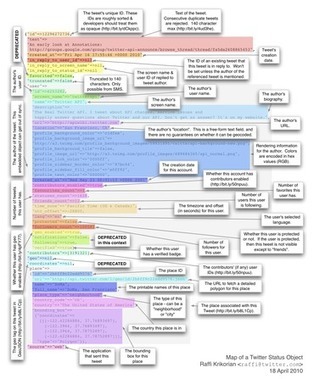
What's (technically) in your tweets? | #datascience #API #twitter

What's (technically) in your tweets? | #datascience #API #twitter | E-Learning-Inclusivo (Mashup) | Scoop.it
Just because you only see 140 characters doesn't mean that Twitter isn't getting complicated behind the scenes. Here's how status objects are evolving.

Via luiy
luiy's curator insight, September 22, 2014 4:26 PM

.. an interesting map of what's going on behind your Twitter stream. As it turns out, there is quite a bit of data associated with not just you as a user, but also with every tweet that you post to the service.

Rescooped by juandoming from e-Xploration
Scoop.it!

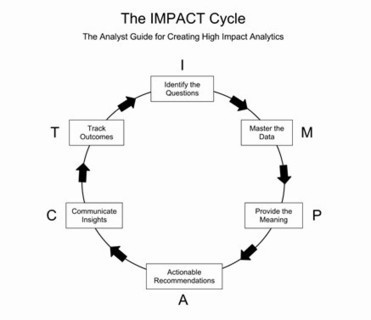
The Impact Cycle – how to think of actionable insights | #datascience #methods

The Impact Cycle – how to think of actionable insights | #datascience #methods | E-Learning-Inclusivo (Mashup) | Scoop.it

Via luiy
luiy's curator insight, July 2, 2014 5:10 AM

I. Identify the question. In a non intrusive way, help your business partner identify the critical business question(s) he or she needs help in answering. Then set a clear expectation of the time and the work involved to get an answer.


M. Master the data.This is the analyst’s sweet spot—assemble, analyze, and synthesize all available information that will help in answering the critical business question. Create simple and clear visual presentations (charts, graphs, tables, interactive data environments, and so on) of that data that are easy to comprehend.


P. Provide the meaning. Articulate clear and concise interpretations of the data and visuals in the context of the critical business questions that were identified.


A. Actionable recommendations. Provide thoughtful business recommendations based on your interpretation of the data. Even if they are off-base, it’s easier to react to a suggestion that to generate one. Where possible, tie a rough dollar figure to any revenue improvements or cost savings associated with your recommendations.


C. Communicate insights. Focus on a multi-pronged communication strategy that will get your insights as far and as wide into the organization as possible. Maybe it’s in the form of an interactive tool others can use, a recorded WebEx of your insights, a lunch and learn, or even just a thoughtful executive memo that can be passed around.


T. Track outcomes. Set up a way to track the impact of your insights. Make sure there is future follow-up with your business partners on the outcome of any actions. What was done, what was the impact, and what are the new critical questions that need your help as a result?

Rescooped by juandoming from Cloud Central
Scoop.it!

INFOGRAPHIC: Big Data Survey: What Are The Trends?

INFOGRAPHIC: Big Data Survey: What Are The Trends? | E-Learning-Inclusivo (Mashup) | Scoop.it
Nearly 1,600 Jaspersoft Community Members Participate in Second Jaspersoft Big Data Survey - San Francisco, February 4, 2014 - Jaspersoft, the Intelligence Inside applications and business....

Via Peter Azzopardi
Peter Azzopardi's curator insight, February 4, 2014 11:33 AM

Very interesting results.

Scooped by juandoming
Scoop.it!

How to Integrate Data and Analytics into Every Part of Your Organization

How to Integrate Data and Analytics into Every Part of Your Organization | E-Learning-Inclusivo (Mashup) | Scoop.it
Start with a clear understanding of what you hope to accomplish.
No comment yet.
Rescooped by juandoming from Edumorfosis.it
Scoop.it!

Data analytics and higher education: George Siemens on the Future Trends Forum

George Siemens spoke with the Future Trends Forum about what's happening with data analytics in education.

Via Ana Cristina Pratas, Edumorfosis
No comment yet.
Scooped by juandoming
Scoop.it!

IBM's Big Data University: Free Online Learning With Over 400,000 Students - Forbes

IBM's Big Data University: Free Online Learning With Over 400,000 Students - Forbes | E-Learning-Inclusivo (Mashup) | Scoop.it
It is widely forecasted that a shortage of skills in data science and analytics will mean a great deal of money is wasted through missed opportunities in coming years. Traditional academic establishments have begun to move to fill the gap. However, most courses teaching the hot topic skillsets such as [...]
No comment yet.
Scooped by juandoming
Scoop.it!

Learning Analytics: Principles and Constraints

Learning Analytics: Principles and Constraints | E-Learning-Inclusivo (Mashup) | Scoop.it
Within the evolution of technology in education, Learning Analytics has reserved its position as a robust technological field that promises to empower instructors and learners in different educational fields. The 2014 horizon report (Johnson et al.,
Mª Jesús García S.M.'s curator insight, June 25, 2015 1:56 AM

Some interesting tips to read on learning analytics

Rescooped by juandoming from digital marketing strategy
Scoop.it!

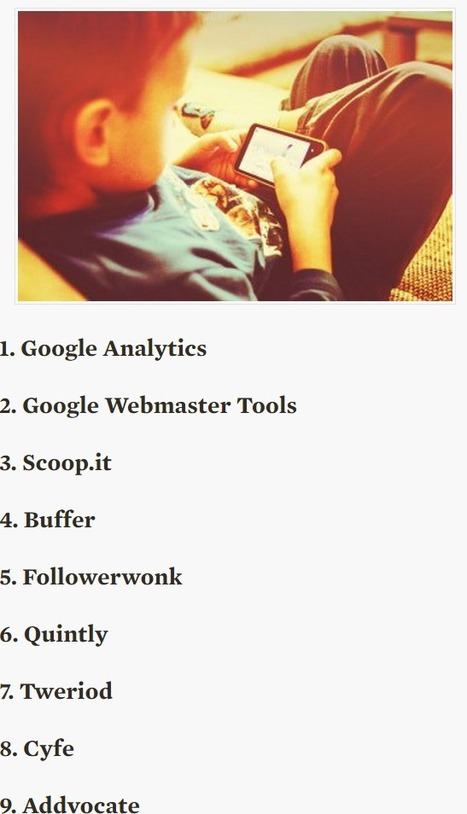
9 Free Analytic Tools to Measure Your Content Effectiveness

9 Free Analytic Tools to Measure Your Content Effectiveness | E-Learning-Inclusivo (Mashup) | Scoop.it

Nine analytic tools to help with analyzing the impact of your content


Via Marteq, malek
Marteq's curator insight, March 29, 2015 9:12 PM

Some of which you're familiar, some not. Click through for a description and link. And not all are free.

malek's curator insight, March 30, 2015 7:55 AM

The starting point is always GOOD CONTENT

Agile Net'Up's curator insight, April 1, 2015 3:01 PM

Tools are made for improved efficiency and effectiveness, here is a good list of Tools.

Rescooped by juandoming from Effective Education
Scoop.it!

Learning analytics don't just measure students' progress – they can shape it

Learning analytics don't just measure students' progress – they can shape it | E-Learning-Inclusivo (Mashup) | Scoop.it
From online forum debates to predictive essay writing software, data showing how students learn can help universities adapt their teaching

Via Grant Montgomery, Sharrock, Mark E. Deschaine, PhD
No comment yet.
Rescooped by juandoming from SCUP Links
Scoop.it!

Learning Analytics and Ethics: A Framework beyond Utilitarianism

Learning Analytics and Ethics: A Framework beyond Utilitarianism | E-Learning-Inclusivo (Mashup) | Scoop.it

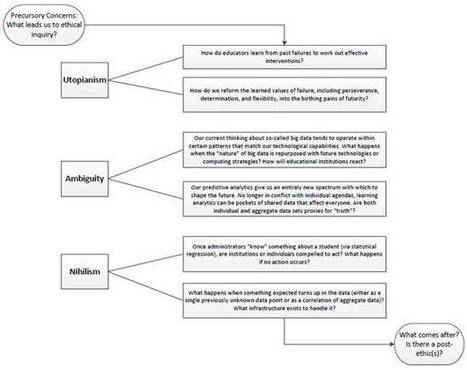
"Learning analytics stand poised to benefit students in previously impossible ways. Alongside innovation, however, ethical discussions need probing questions, assessments of possible outcomes, and active disagreement about future developments. Ethical modeling will not achieve these, at least not in a substantive way; principled reflection needs to keep up with the speed of innovation as closely as possible. An inner matrix of tensions will achieve ethical reflection aligned with innovation — or at least get us closer to that goal. When schools or companies build new learning analytics systems, or when schools are deciding between competing products, ethical discussions ought to be in the forefront of outcomes-based commitments. The proposed tensions of utopianism (what is the very best outcome?), ambiguity (are the outcomes knowable?), and nihilism (how are unexpected outcomes handled?) can help institutions and companies fulfill the goal of assisting student success."


Via Society for College and University Planning (SCUP)
Society for College and University Planning (SCUP)'s curator insight, September 9, 2014 8:57 AM

The author, James E. Willis, III is an educational assessment specialist at Purdue University.

Rescooped by juandoming from visualizing social media
Scoop.it!

The World of Social Media Monitoring & Analytics [infographic]

The World of Social Media Monitoring & Analytics  [infographic] | E-Learning-Inclusivo (Mashup) | Scoop.it
This infographic looks at the growth and future of analytics tool marketing and recommend 14 best social media analytics tools that will assist you to make accurate, insightful predictions.

Via Lauren Moss
pulau seribu wisata's curator insight, March 16, 2014 11:13 PM

i like this, The World of Social Media Monitoring & Analytics


Jean-Marie Grange's curator insight, March 20, 2014 10:43 AM

All the tools to monitor and analyze your social media activities. Nice infographic

Carole Borie's curator insight, April 2, 2014 10:44 PM

Analytics tools to improve your business on the Web

Rescooped by juandoming from Curation, Social Business and Beyond
Scoop.it!

A Glimpse into The Mobile World In 60 Seconds [Infographic]

A Glimpse into The Mobile World In 60 Seconds [Infographic] | E-Learning-Inclusivo (Mashup) | Scoop.it

This article was written by Chris Velazco for Tech Crunch


The infographic from ad exchange, Mobclix in this piece aims to highlight what goes down in the mobile world in 60 seconds.


****Before you read the excerpt, I thought it was particularly interesting to post one of the comments made by a reader who saw the infograph.  He wasn't the only one that said this was an unfinished report. I think these people are missing the point here.


**This is a mere glimpse, the tip of the iceberg, to give us an idea of the magnitude of this exploding industry, it's not the be all end all report. I'm very careful what I post, I don't want to add to the noise, so look at the infographic with this in mind and imagine how it would look if you added what one of the readers said below.


One reader's comment:


Ulrich Weihler:  "Nice idea, but major things for spending mobile time are missing, surfing content, using communities, using apps, internet usage, downloading music and videos, listening to music or watching videos, sms and actually phone connecions to talk, etc.. that's why the chart looks a bit strange."


Excerpt:


"In case you were curious, in the time it took me to write out that first sentence, over 23,000 iOS apps were downloaded from Apple’s App Store.


** Mobclix used data directly from app publishers, industry sources, and a little old-fashioned arithmetic to get the 60 second stats you see below.


Of course, considering Mobclix’s background, there had to be some ad-related factoids in the mix too.


Mobile advertisers will be glad to know (if they didn’t already) that some 4,111 ads are tapped each minute, though it almost makes you wonder how many ads

were ignored in the same 60 second timeframe.


Curated by JanLGordon covering "The Explosion of Mobile Web & Beyond"


See Infographic  [http://tcrn.ch/u4No0L]


Via janlgordon
Tom George's comment, November 6, 2011 6:25 PM
Jan your curation is rocking, hey did you happen to catch this gem yet
http://chime.in/user/Internetbillboards
janlgordon's comment, November 6, 2011 7:56 PM
Thanks Tom! Thanks for telling me about this, it's very cool, just signed up and I'm following you:-)
Tom George's comment, November 6, 2011 8:15 PM
Sure Jan I am happy to share also please except this invite
http://chime.in/community/curators