¿Estás teniendo problemas para acceder a Facebook? Si es así, no te preocupes, no estás solo. Es algo que le está ocurriendo a muchos otros usuarios ta
Get Started for FREE
Sign up with Facebook Sign up with X
I don't have a Facebook or a X account


 Your new post is loading...
 Your new post is loading...
Your new post is loading...
¿Estás teniendo problemas para acceder a Facebook? Si es así, no te preocupes, no estás solo. Es algo que le está ocurriendo a muchos otros usuarios ta 

EntreCulturas's curator insight,
October 14, 2017 5:36 PM
Share your insight
Sign up to comment

we might need a “data humanities” and a “data rhetoric” that paralleled the emergence of data science

Stanford researchers assessed students from middle school to college and found they struggled to distinguish ads from articles, neutral sources from biased ones and fake accounts from real ones.

"Back in September, Facebook made a deal with Summit Public Schools. Don't worry if you didn't hear about it when it happened – it was a quiet event, without a lot of fanfare. With that being said, the implications of this partnership might change everything we know about public education. What are Summit Public Schools? ..." Via Leona Ungerer

Une formation pour réconcilier les enseignants du secondaire avec les réseaux sociaux. Ou, comment tirer le meilleur parti de Twitter, Facebook et Pinterest en classe pour susciter l'intérêt des é... Via Marco Bertolini, Elena Pérez

Marco Bertolini's curator insight,
February 11, 2015 2:23 AM
Comment enseigner en utilisant Facebook, Twitter ou Pinterest ? 
Daniel Morgenstern's curator insight,
February 11, 2015 10:11 AM
Du réseau social ennemi de l’école au réseau social allié du professeur.
Les groupes secrets de Facebook : une possibilité intèressante ma foi !

Desde hace muchos años se a satanizado el uso de las redes sociales en la educación, ahora los adolescentes pasan en un promedio de 8,5 horas a la semana en estas redes, y a mi punto de vista es una ventaja que los docentes, maestr@s y profesor@s debemos aprovechar, es así que les compartiré 20 ideas de lo que podemos realizar en facebook; aclaro tomo esta red social por ser unas de las más visitadas en la actualidad, sin más preámbulos aquí están: Via Gumersindo Fernández
PEOPLE who frequent social media sites like Facebook and Twitter have come to rely on the news feed as a crucial filter that sifts through news, personal stories, trends and facts on their behalf. So it is no wonder that many people have strong opinions about how those companies handle their feeds. Those opinions have become more vocal recently, as the companies have adjusted the feeds. The point of the changes, the companies say, is to make the feeds more interesting, engaging or profitable. Via KazzaDrask Media, Brian Yanish - MarketingHits.com

luiy's curator insight,
September 16, 2014 10:45 AM
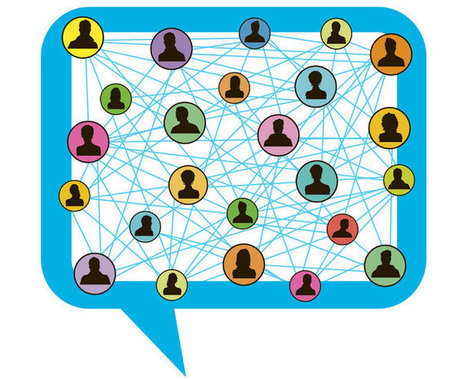
Think of communities as very similar to the segments identified in a brand’s customer segmentation model. (With demographics analysis layered on, you might even find that they’re the same.) While direct marketing communications is often customized by segment, historically this hasn’t been something brands have done in social. But, using social network analysis and also Twitter & Facebook ad targeting, it’s possible to send specific messages to specific groups of people.
Powered by Pulsar TRAC these could be people engaging in a specific conversation, individuals sharing a piece of content online, or the followers of an account on Twitter. Any group of people, in essence, as long as we can define that audience through some property of its behaviour in social media – such as keyword, user bio, or location.
Community analysis allows brands to really understand the behavior of their audiences in a way they can’t replicate with offline, non-social data.

Phillip Newsome's curator insight,
September 26, 2014 10:25 AM
The lesson here is simply don't be overwhelmed by the volume of activity. Narrow your focus, define your audience as tightly as possible, talk to them in terms relevant to their lives and be creative. 
John Norman's curator insight,
January 11, 2015 11:22 PM
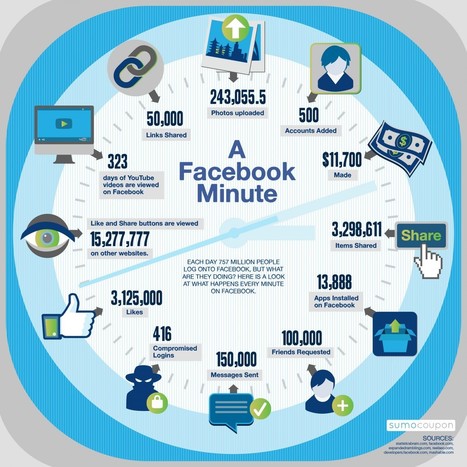
Nearly as busy as a New York minute! Lots of interesting facts to discuss at your next coffee break.

It’s important to know when the highest percentage of your audience is eavesdropping on your social networks—so that when you share content you’ll get maximum exposure. Use the following data to learn when your audience is most likely to tune in. Via Frédéric DEBAILLEUL
![[infographie] Facebook : 10 ans de social media | E-Learning-Inclusivo (Mashup) | Scoop.it](https://img.scoop.it/hWmKwfz536gSphjVRyWwGDl72eJkfbmt4t8yenImKBVvK0kTmF0xjctABnaLJIm9)
Pour une fois, il ne s'agit pas d'un anniversaire de plus souhaité sur votre mur Facebook... Oui oui, on sait que ça sonne souvent faux... Mais cette fois, ... Via Mon-Habitat Web, Arobasenet

Valerie Demont's curator insight,
February 5, 2014 2:00 AM
Sujet bouillant de ces jours : Facebook a 10 ans !
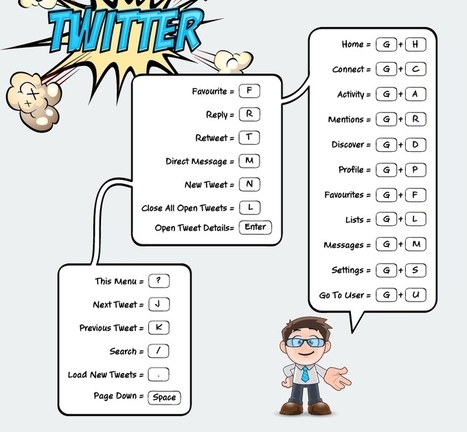
La rapidez es una de las principales características que debe destacar en el trabajo de un periodista, especialmente si se dedica a desarrollar plataformas sociales. Para un manejo veloz de las funciones de estos servicios existen diferentes atajos que pueden activarse con el teclado del dispositivo que se utiliza. Lo ideal es que las combinaciones se memoricen y así uno pueda acceder a directamente a lo que necesita. Te presentamos una infografía realizada por Quintly que reúne los atajos que están habilitados en las principales redes sociales. Via Belén Cotón Méndez, Luis Eduardo Muñoz Ortiz, Mª Carmen Jiménez, Jesús Hernández, Web-On!, Charo Neira García

Web-On!'s curator insight,
December 26, 2013 2:09 PM
Nuestro teclado nos esconde un monton de posibilidades a la hora de utilizar de forma más ágil las redes sociales. Descubre a través de sncillas infografias cuales son esos atajos para Facebook, Twitter, Youtube y Google + |

Muchas instituciones educativas están implementando plataformas de gestión de cursos en línea que buscan apoyar la modalidad presencial enriqueciéndola con módulos de foros de discusión asincrónicos en los que los participantes deben hacer aportes argumentados, defenderlos, contraponer opiniones o ideas, comparar sus hipótesis con las de otros y objetar las razones planteadas en la discusión. Aquí se explica en qué consiste este tipo de foro y se ofrecen, para docentes y estudiantes, recomendaciones de uso. Via Minerva Bueno

Facebook y Fundación Pere Tarrés han presentado en Barcelona las conclusiones de ‘Emprendimiento y Barrio’, un proyecto pionero que ha unido a dos generaciones para compartir experiencias y poner en Via Silvano Poblano Morales

"There is no denying that doing this is much harder than it looks as a written statement. In the digital age, removing all of your information from online websites, especially those in the niche of social media, can happen to be very difficult and even frustrating." Via blasco Louis

Facebook founder Mark Zuckerberg and his wife, Priscilla Chan, are throwing their weight behind personalized learning software. Here's what that is. Via Tom D'Amico (@TDOttawa)
Que los jóvenes se pasan gran parte del día en las Redes Sociales es un hecho totalmente veraz. Esto no siempre es perjudicial para su educación sino que también se puede conseguir que las mismas ayuden en su estudio y formación. Via Mauricio M. Escudero

Tecnología aplicada a la educación 's curator insight,
September 13, 2018 9:51 PM
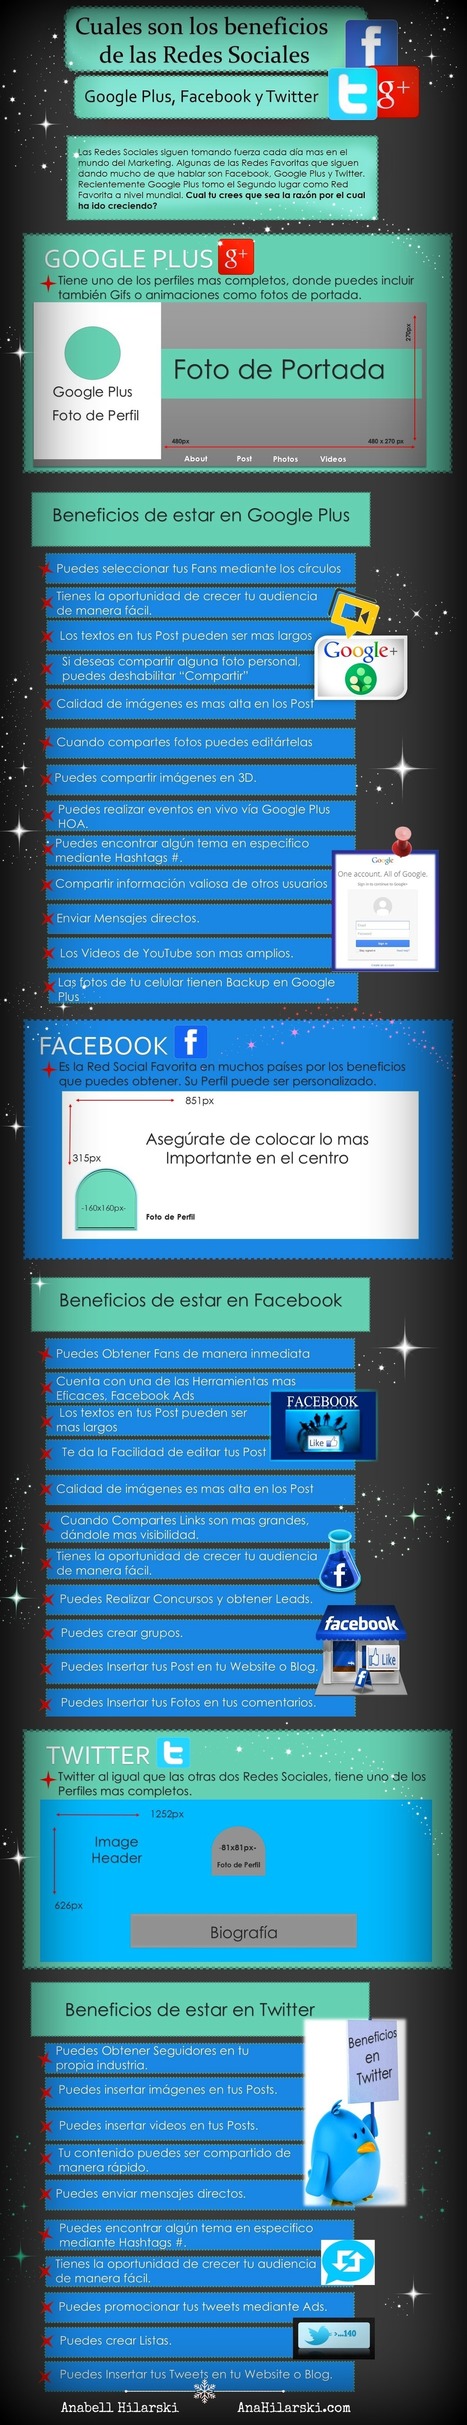
Nos encontramos en una era donde la tecnología forma parte de la vida cotidiana, y las redes sociales son un claro ejemplo, adultos y jóvenes pasan horas en estas paginas, sin embargo se le puede sacar un gran provecho sabiendo utilizarlas de una forma adecuada. Facebook es una de las redes de comunicación mas conocidas en la población y puede ser un medio para compartir y sugerir material educativo, y así darle un sentido mas provechoso.

Kely Borbor's curator insight,
May 29, 2020 9:27 PM
Los nuevos entornos de aprendizaje surgieron y trajeron oportunidades no solo para quienes quieren estudiar, sino para aquellos que desean emprender y alcanzar resultados mayores. El gran destaque del mercado educativo es, sin lugar a dudas, el aula virtual.

Fundación Telefónica canaliza la Acción Social y Cultural del Grupo Telefónica y está presente en Argentina, Brasil, Chile, Colombia, Ecuador, España, México, Perú y Venezuela. Aunque la actuación de la Fundación es local en todos y cada uno de estos paises, su enfoque es global, y si bien las Fundaciones han sido constituidas de acuerdo con las legislaciones respectivas de cada país, todas ellas comparten una misma visión, objetivos y métodos de trabajo

Facebook levels the playing field: Dyslexic students learning through digital literacies Via Fiona Harvey

Fiona Harvey's curator insight,
September 25, 2014 1:49 PM
Social media platforms that students like used for their educational benefit. Probably useful for all students not just dyslexic

Time for a game of Versus!
Via Martin (Marty) Smith

From
gigaom

The big U.S. tech companies’ quest to connect more people in developing countries is stepping up, with Facebook now joining Microsoft in a West African white space broadband project.

The most popular site on the Internet can be leveraged in the classroom in engaging and useful ways. Post collaboratively written with guest author Heather Via Patty Ball
luiy's curator insight,
January 4, 2014 12:25 PM
I’ve received a lot comments about the image, many asking for more details on how I created it. When I tell people I used R, the reaction I get is roughly what I would expect if I told them I made it with Microsoft Paintand a bottle of Jägermeister. Some people even questioned whether it was actually done in R. The truth is, aside from the addition of the logo and date text, the image was produced entirely with about 150 lines of R code with no external dependencies. In the process I learned a few things about creating nice-looking graphs in R.
Transparency and Faking It My first attempt at plotting the data involved plotting very transparent lines. Unfortunately there was just too much data to get a meaningful plot — even at very low opacity, there were enough lines to make the entire image just a bright blob. When I increased the transparency more, the opacity was rounded down to zero by my graphics device and the result was that nothing was drawn. The solution was to manipulate the drawing order of the lines. I used a simple loop over my data to draw the lines, so it was easy to control which lines are drawn first using order(). I created an ordering based on the length of the lines, so that longer lines were drawn “behind” the shorter, more local lines. Then I used colorRampPalette() to generate a color palette from black to blue to white, and colored the lines according to order they were drawn.
From
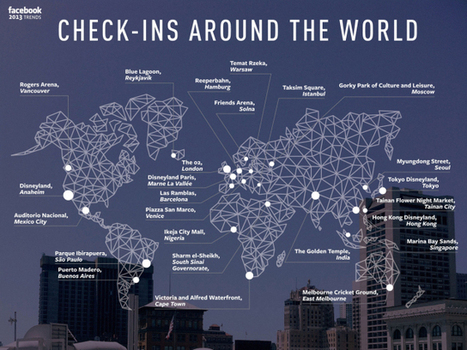
qz
One thing that unites Facebook users in Asia, Europe and America: They all love Disneyland, and want everybody to know about it. Four of the top 25 locations that were most checked-in to by Facebook users this year—excluding transportation hubs such as airports—were Disneyland Tokyo, Disneyland Hong Kong, Disneyland Paris and Disneyland California. Apart from Disneyland, many of the top places on Facebook’s list were predictable tourist attractions: The Blue Lagoon in Iceland, Piazza San Marco in Venice, the Sharm el-Sheikh resort in Egypt, Las Ramblas in Barcelona. Via Lauren Moss, harish magan, malek
|