E-Learning-Inclusivo (Mashup)
1.1M views | +3 today
Follow
E-Learning-Inclusivo (Mashup)
Aprendizaje con TIC basado en los aprendices.
Curated by juandoming
Your new post is loading...
Rescooped by juandoming from Creative teaching and learning
Scoop.it!

Online teaching methods 

Online teaching methods  | E-Learning-Inclusivo (Mashup) | Scoop.it

"There are many different ways instructors can teach and work with online learners. This section highlights various methods of teaching and communicating with students in the online learning environment, and techniques instructors might use to actively engage remote learners and individualize instruction. Readers will also explore the educational technology that makes online teaching, learning, and collaboration possible ..."

©


Via Leona Ungerer
No comment yet.
Rescooped by juandoming from e-Xploration
Scoop.it!

Visualizing Categorical Data as Flows with Alluvial Diagrams | #dataviz #methods #tools

Visualizing Categorical Data as Flows with Alluvial Diagrams | #dataviz #methods #tools | E-Learning-Inclusivo (Mashup) | Scoop.it

Via luiy
luiy's curator insight, June 7, 2014 12:04 PM

Alluvial diagrams are a type of flow diagram that  have traditionally been used to visually show changes in network structures over time. Density Design has included Alluvial Diagrams in their RAW online visualization tool and explored its use to show “relations between dimensions of categorical data.”


RAW is such a wonderfully easy tool to use that I wanted to explore the Alluvial diagram functionality with a few different data sets to see how the visualizations would come out.


Rescooped by juandoming from e-Xploration
Scoop.it!

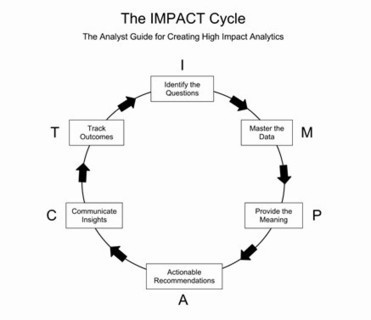
The Impact Cycle – how to think of actionable insights | #datascience #methods

The Impact Cycle – how to think of actionable insights | #datascience #methods | E-Learning-Inclusivo (Mashup) | Scoop.it

Via luiy
luiy's curator insight, July 2, 2014 5:10 AM

I. Identify the question. In a non intrusive way, help your business partner identify the critical business question(s) he or she needs help in answering. Then set a clear expectation of the time and the work involved to get an answer.


M. Master the data.This is the analyst’s sweet spot—assemble, analyze, and synthesize all available information that will help in answering the critical business question. Create simple and clear visual presentations (charts, graphs, tables, interactive data environments, and so on) of that data that are easy to comprehend.


P. Provide the meaning. Articulate clear and concise interpretations of the data and visuals in the context of the critical business questions that were identified.


A. Actionable recommendations. Provide thoughtful business recommendations based on your interpretation of the data. Even if they are off-base, it’s easier to react to a suggestion that to generate one. Where possible, tie a rough dollar figure to any revenue improvements or cost savings associated with your recommendations.


C. Communicate insights. Focus on a multi-pronged communication strategy that will get your insights as far and as wide into the organization as possible. Maybe it’s in the form of an interactive tool others can use, a recorded WebEx of your insights, a lunch and learn, or even just a thoughtful executive memo that can be passed around.


T. Track outcomes. Set up a way to track the impact of your insights. Make sure there is future follow-up with your business partners on the outcome of any actions. What was done, what was the impact, and what are the new critical questions that need your help as a result?