"Technological and digital literacy are crucial for university students who hope to truly contribute to the world in the 21st century ..."
Via Leona Ungerer
Get Started for FREE
Sign up with Facebook Sign up with X
I don't have a Facebook or a X account


 Your new post is loading...
 Your new post is loading...
Your new post is loading...
"Technological and digital literacy are crucial for university students who hope to truly contribute to the world in the 21st century ..." Via Leona Ungerer 
No comment yet.
Sign up to comment

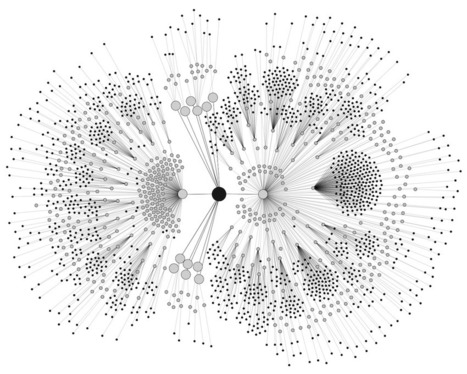
Traditionally, cities have been viewed as the sum of their locations – the buildings, monuments, squares and parks that spring to mind when we think of ‘New York’, ‘London’ or ‘Paris’. In The new science of cities (Amazon US| Amazon UK), Michael Batty argues that a more productive approach is to think of cities in terms of … Via luiy

luiy's curator insight,
March 23, 2014 8:16 AM
Cities and network analysis.
Viewing cities as networks allows us to use the toolbox of network analysis on them, employing concepts such as ‘cores’ and ‘peripheries’, ‘centrality’, and ‘modules’. Batty says that an understanding of how different types of network intersect will be the key that really unlocks our understanding of cities.
Cities, like many other types of network, also seem to be modular, hierarchical, and scale-free – in other words, they show similar patterns at different scales. It’s often said that London is a series of villages, with their own centres and peripheries. but the pattern also repeats when you zoom out and look at the relationships between cities. One can see this in the way that London’s influence really extends across Europe, and in the way that linked series of cities, or ‘megalopolises‘, are growing in places such as the eastern seaboard of the US, Japan’s ‘Taiheiyō Belt‘, or the Pearl River Delta in China. 
Eli Levine's curator insight,
March 23, 2014 12:55 PM
And there you have it.
The blue prints for understanding empirically a city, a society, a nation.
![What Social Networks Should You Use in 2014? [INFOGRAPHIC] | E-Learning-Inclusivo (Mashup) | Scoop.it](https://img.scoop.it/zXxxQsjCMCjVz0_lYlM_Izl72eJkfbmt4t8yenImKBVvK0kTmF0xjctABnaLJIm9)
We’re now into a whole new year – but which social networks should have your full attention this year? Via Lauren Moss, Glauco Ulises Quesada Ramirez

Dillon Thomas's curator insight,
February 1, 2014 9:15 AM
TO FULLY UNDERSTAND AND HAVE STATS AND DATA .. FOR EXAMPLE YOUR AUDIENCE FOR YOUR INFOGRAPHIC AND THEN TP UNDERSTAND WHAT SOCIAL MEDIA THEY USE BOTH: .. quanitatively and qualititatively .. (How much time they spend and what content they are utilizing or extracting)
THIS IS CRITICAL TO MAKING AN INFOGRAPHIC TARGETED TO AN AUDIANCE SPECIFIC
ALSO: I recommend Lauren Moss SCOOP - VISUALIZING SOCIAL MEDIA 
Amy Williamson's curator insight,
February 5, 2014 5:43 AM
A must read for anyone working in social media! 
Monica S Mcfeeters's curator insight,
March 30, 2014 9:16 AM
Do you wonder where to put most of your online time for the best reach to viewers? Here is helpful info to help you decide.
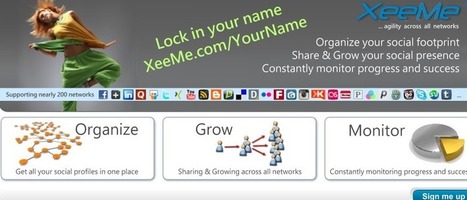
Living across all networks - XeeMe is a social engagement tool that helps increasing connections, raising popularity and strengthen relationships across all networks. ... Via Ana Cristina Pratas
|
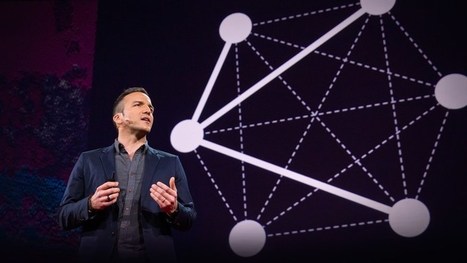
How does knowledge grow?
Sometimes it begins with one insight and grows into many branches; other times it grows as a complex and interconnected network. Infographics expert Manuel Lima explores the thousand-year history of mapping data -- from languages to dynasties -- using trees and networks of information.
It's a fascinating history of visualizations, and a look into humanity's urge to map what we know. Via Kenneth Mikkelsen, Ricard Lloria

This guide shows you how to connect to WiFi network from command line in Linux. Detailed guide on WPA/WPA2 network connectivity issues. Via Gonzalo San Gil, PhD.
![[#Tech #knowledge:] #OpenStack #OpenSource #CloudComputing #Software | * #Share The #Cloud | E-Learning-Inclusivo (Mashup) | Scoop.it](https://img.scoop.it/N5drHVmjeODXAH-rFnk-qTl72eJkfbmt4t8yenImKBVvK0kTmF0xjctABnaLJIm9)
OpenStack OpenStack is a global collaboration of developers and cloud computing technologists producing the ubiquitous open source cloud computing platform for public and private clouds. Via Gonzalo San Gil, PhD.
We’re now into a whole new year – but which social networks should have your full attention this year? Via Lauren Moss, Cercle d'autodidactes
Dillon Thomas's curator insight,
February 1, 2014 9:15 AM
TO FULLY UNDERSTAND AND HAVE STATS AND DATA .. FOR EXAMPLE YOUR AUDIENCE FOR YOUR INFOGRAPHIC AND THEN TP UNDERSTAND WHAT SOCIAL MEDIA THEY USE BOTH: .. quanitatively and qualititatively .. (How much time they spend and what content they are utilizing or extracting)
THIS IS CRITICAL TO MAKING AN INFOGRAPHIC TARGETED TO AN AUDIANCE SPECIFIC
ALSO: I recommend Lauren Moss SCOOP - VISUALIZING SOCIAL MEDIA
Amy Williamson's curator insight,
February 5, 2014 5:43 AM
A must read for anyone working in social media!
Monica S Mcfeeters's curator insight,
March 30, 2014 9:16 AM
Do you wonder where to put most of your online time for the best reach to viewers? Here is helpful info to help you decide. |