
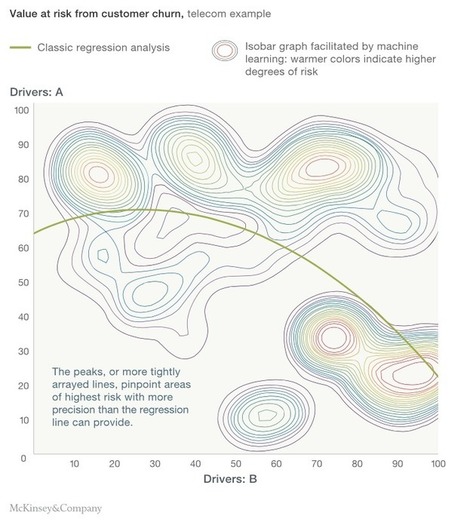

This article explains in brief the differences between Machine Learning & Statistical modeling including the algorithms, required efforts, output & a case study.
Get Started for FREE
Sign up with Facebook Sign up with X
I don't have a Facebook or a X account


 Your new post is loading...
 Your new post is loading...
Your new post is loading...
This article explains in brief the differences between Machine Learning & Statistical modeling including the algorithms, required efforts, output & a case study. 
No comment yet.
Sign up to comment

Take a look at the first day of school celebrations around the world!
![A Day in the Life of the Modern Smartphone User [Infographic] | E-Learning-Inclusivo (Mashup) | Scoop.it](https://img.scoop.it/-snSWWvJGeWHqTzwEv49tjl72eJkfbmt4t8yenImKBVvK0kTmF0xjctABnaLJIm9)
Data and information from Citrix about mobile trends shows us we’re not the only ones growing increasingly attached to our mobile devices. Whether it’s a personal, social or business setting, people are using their smartphones in more places and ways than ever before and the increasing speed of smartphones encourages us to rely on them more often. As the data here shows, we share more phone habits than we might have thought. Via Lauren Moss, xavier suñé

Julia Sokolova's curator insight,
March 31, 2014 4:54 AM
Social media is made up of 63% images and 32% videos
50% of mobile ads are served to 50% of smartphone users
1/2 of the top health apps are fitness apps, which require more data to track a user's status
1.5% of a user's mobile data usage comes from network-connected gaming
57% of people blame the mobile operator when a video stalls 
Mónica Vázquez's curator insight,
April 2, 2014 2:30 PM
Las apps para fitness en aumento mientras 35% dormimos junto a nuestros celulares 
Daniel Vince's curator insight,
April 14, 2014 1:52 PM
Interesting Info graphic about smartphone usage.
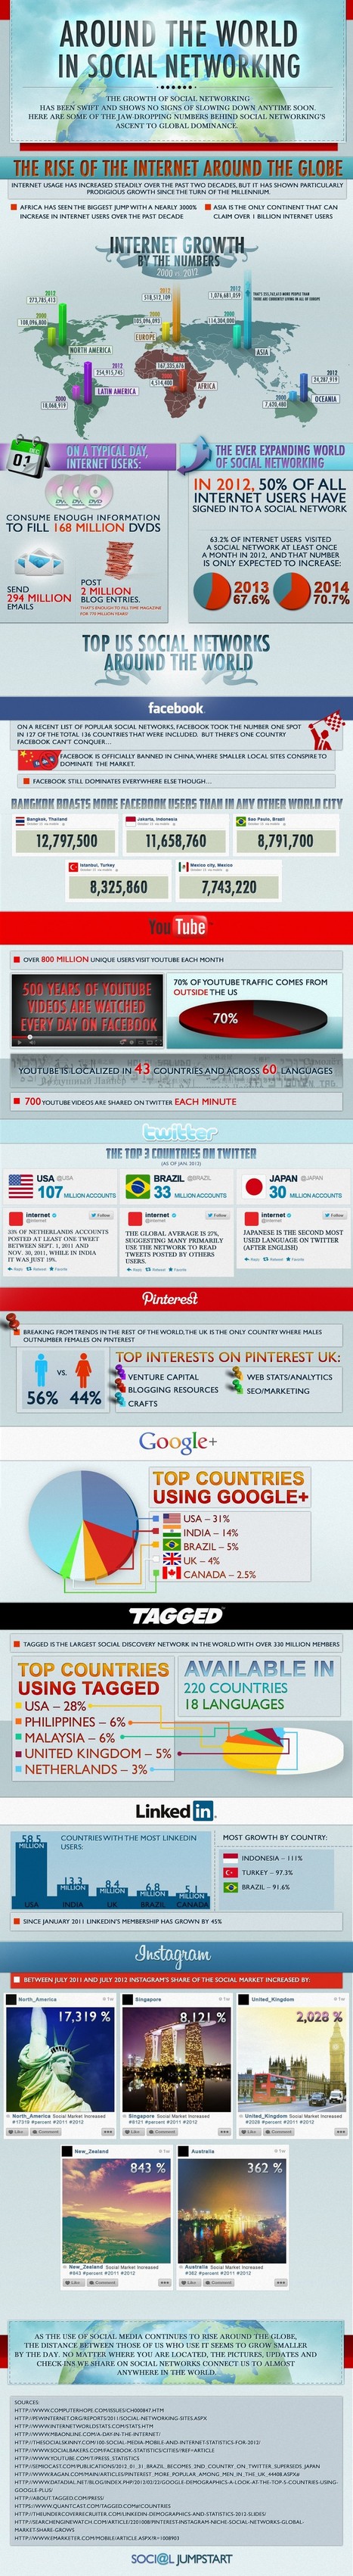
The world of social media is increasing and has a powerful role to play in the future. In 2012, more than 63% of online users visited more number of social media websites than any other types, and that number is expected to continue going up through 2013. View this infographic to find more statistics about online behavior and the use of Facebook, Twitter, LinkedIn, YouTube, Pinterest and Instagram across the globe... Via Lauren Moss

Angie Mc's curator insight,
January 26, 2014 10:13 AM
Making friends worldwide is one of the best parts of participating in social media. I especially love how Twitter makes it easy to connect across time zones. 
Lydia Gracia's curator insight,
February 14, 2014 5:20 AM
La Guia completa del Social Media en el Mundo
![A Glimpse into The Mobile World In 60 Seconds [Infographic] | E-Learning-Inclusivo (Mashup) | Scoop.it](https://img.scoop.it/zwIobpoFw9o7fBl0_AtvVjl72eJkfbmt4t8yenImKBVvK0kTmF0xjctABnaLJIm9)
This article was written by Chris Velazco for Tech Crunch
The infographic from ad exchange, Mobclix in this piece aims to highlight what goes down in the mobile world in 60 seconds.
****Before you read the excerpt, I thought it was particularly interesting to post one of the comments made by a reader who saw the infograph. He wasn't the only one that said this was an unfinished report. I think these people are missing the point here.
**This is a mere glimpse, the tip of the iceberg, to give us an idea of the magnitude of this exploding industry, it's not the be all end all report. I'm very careful what I post, I don't want to add to the noise, so look at the infographic with this in mind and imagine how it would look if you added what one of the readers said below.
One reader's comment:
Ulrich Weihler: "Nice idea, but major things for spending mobile time are missing, surfing content, using communities, using apps, internet usage, downloading music and videos, listening to music or watching videos, sms and actually phone connecions to talk, etc.. that's why the chart looks a bit strange."
Excerpt:
"In case you were curious, in the time it took me to write out that first sentence, over 23,000 iOS apps were downloaded from Apple’s App Store.
** Mobclix used data directly from app publishers, industry sources, and a little old-fashioned arithmetic to get the 60 second stats you see below.
Of course, considering Mobclix’s background, there had to be some ad-related factoids in the mix too.
Mobile advertisers will be glad to know (if they didn’t already) that some 4,111 ads are tapped each minute, though it almost makes you wonder how many ads were ignored in the same 60 second timeframe.
Curated by JanLGordon covering "The Explosion of Mobile Web & Beyond"
See Infographic [http://tcrn.ch/u4No0L] Via janlgordon

Tom George's comment,
November 6, 2011 6:25 PM
Jan your curation is rocking, hey did you happen to catch this gem yet
http://chime.in/user/Internetbillboards 
janlgordon's comment,
November 6, 2011 7:56 PM
Thanks Tom! Thanks for telling me about this, it's very cool, just signed up and I'm following you:-)
Tom George's comment,
November 6, 2011 8:15 PM
Sure Jan I am happy to share also please except this invite
http://chime.in/community/curators |

The Top Learning Management System Statistics and Facts For 2015! Check also the The Top LMS Statistics and Facts For 2015 You Need To Know Infographic!
![10 Surprising Social Media Facts [INFOGRAPHIC] | E-Learning-Inclusivo (Mashup) | Scoop.it](https://img.scoop.it/dDSJ3-mmHxUHqCKDlA1GOzl72eJkfbmt4t8yenImKBVvK0kTmF0xjctABnaLJIm9)
Here's an infographic that lists ten essential facts you should keep in mind when using social media to market your business. Social media is not only a great platform for social interactions: it’s ideal for digital marketing, and there’s a plethora of social media statistics floating around the Internet... Via Lauren Moss

THECR8TIVEs's curator insight,
July 31, 2014 2:15 PM
Are you getting the most out of your social networks? if not read this 
Tony Guzman's curator insight,
August 1, 2014 9:46 AM
Infographic indicating some social media best practices 
Two Pens's curator insight,
August 1, 2014 12:36 PM
Finally. An infographic with both good design and great, relevant facts.
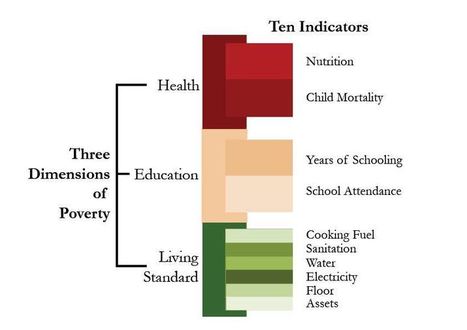
"The global Multidimensional Poverty Index (MPI) is an international measure of acute poverty covering over 100 developing countries. It complements traditional income-based poverty measures by capturing the severe deprivations that each person faces at the same time with respect to education, health and living standards." Via Javier Marrero Acosta

AHS Model UN's curator insight,
November 19, 2015 2:13 PM
The MPI was developed out of a desire to fill some of the gaps in the HDI's applicability and utility. Allow me to quote the editor of one the NCGE's journals, the Geography Teacher, on the usefulness of the MPI website for classroom use: "With the infographics, maps, graphs, country briefings, and case studies, you have a ready-made lesson activities to demonstrate patterns of fertility, mortality, and health for a population unit, and access to health care, education, utilities, and sanitation for an Industrialization and Economic Development Unit. Connections can also be made to malnutrition and water, as well as to key concepts such as pattern and scale, to key geographical skills such as how to use and think about maps and geospatial data, and to the use of online maps and online data." Also, this article from the World Bank also give a run-down on the key findings of the MPI in 2014.
Tags: statistics, population, development, unit 2 population, unit 6 industry.
The world of social media is increasing and has a powerful role to play in the future. In 2012, more than 63% of online users visited more number of social media websites than any other types, and that number is expected to continue going up through 2013. View this infographic to find more statistics about online behavior and the use of Facebook, Twitter, LinkedIn, YouTube, Pinterest and Instagram across the globe... Via Lauren Moss, Professor Jill Jameson
Angie Mc's curator insight,
January 26, 2014 10:13 AM
Making friends worldwide is one of the best parts of participating in social media. I especially love how Twitter makes it easy to connect across time zones.
Lydia Gracia's curator insight,
February 14, 2014 5:20 AM
La Guia completa del Social Media en el Mundo

Companies are increasingly using data-driven testing and measurement in the hiring and evaluation of employees — a field called work force science.
|


