![[Data Visualization] What does the global map of refugees (really) looks like? | E-Learning-Inclusivo (Mashup) | Scoop.it](https://img.scoop.it/Jlzx_TE5AiQXM8YNPJMArDl72eJkfbmt4t8yenImKBVvK0kTmF0xjctABnaLJIm9)

Digital humanities, Data visualization, Network analysis
Get Started for FREE
Sign up with Facebook Sign up with X
I don't have a Facebook or a X account


 Your new post is loading...
 Your new post is loading...
Your new post is loading...
Digital humanities, Data visualization, Network analysis 
No comment yet.
Sign up to comment
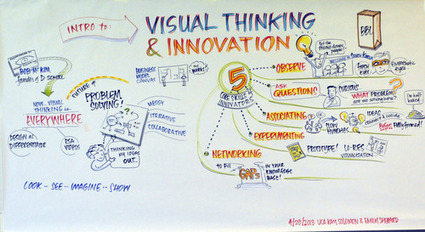
“Visual thinking is the foundation for being creative and solving some of the most complex problems,” explained author and founder of Innovation Studio Lisa Kay Solomon. Solomon and Emily Shepard of The Graphic Distillery discussed the key role of visual thinking in innovation at a recent Stanford GSB Mastery in Communication Initiative talk. Below, they share five visual-thinking based skills that disruptive innovators must master: Via Sharrock
I have been a fan of Visible Thinking Routines which were developed by Project Zero from Havard, for a while now. I have used these routines with students, as blogging routines and in professional... Via Beth Dichter, Elke Höfler

Vanessa Camilleri's curator insight,
January 27, 2015 6:09 AM
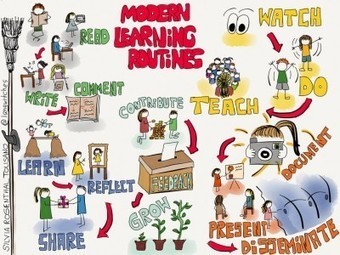
A really wonderful representation of what being digital in this era is all about - learning in the digital era, is more of a contribution rather than a passive absorption of online information. 
veroco's curator insight,
February 10, 2015 12:42 PM
Nice vision : the "modern learning" routines => Read - Comment - Write / Watch - Do - Teach / Contribute - Feedback - Grow... 
Dr. Deborah Brennan's curator insight,
April 2, 2015 9:34 AM
These thinking routines can help teachers move toward teaching processes for learning rather than content alone. In the era of ever increasing knowledge, we need to help students learn how to learn.
That being said, these routines can also be used as a model for teachers by using them as options for professional development,

A collection of educational infographics for students, teachers, parents, and other interested critical thinkers. Via Paul Murray
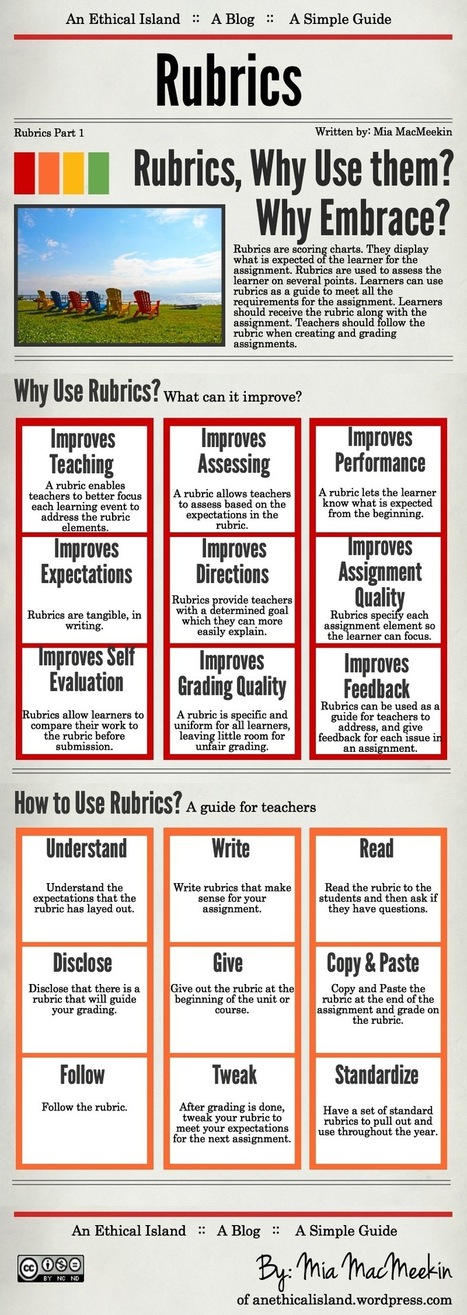
I have recently been shocked at the fact that educators don't really see the need for a rubric. They either find them too specific or too vague. But, I am not really sure they are seeing the big pi... Via Beth Dichter, Lynnette Van Dyke

Beth Dichter's curator insight,
May 7, 2014 9:24 PM
A new infographic from An Ethical Island with a focus on rubrics provides an explanation as well as a section on: * How to Use Rubrics? A guide for teachers. Rubrics help students understand the expectations. This post provides information that may help you create rubrics that help students improve their ability to meet the requirements.
Beth Dichter's curator insight,
May 3, 2014 10:51 PM
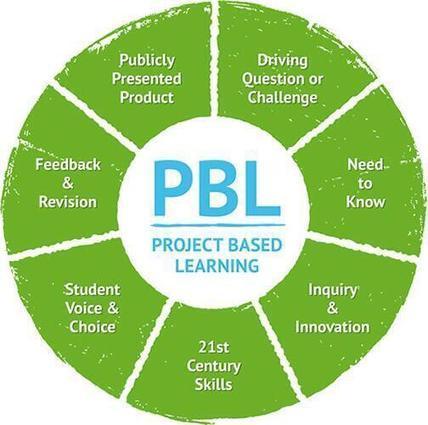
This is a quick view of Project Based Learning that may help your students (or teachers in your school new to PBL) understand the key components: * Driving question or challenge * Need to know * Inquiry and innovation * 21st century skills * Student voice and choice * Feedback and revision * Publicly presented product Project Based Learning is a great way for students to engage in authentic learning projects. For more information on Project Based Learning (and lots of great resources) check out the Buck Institute for Learning website located at http://bie.org/ They have been around for over 25 years and recently revamped their website.
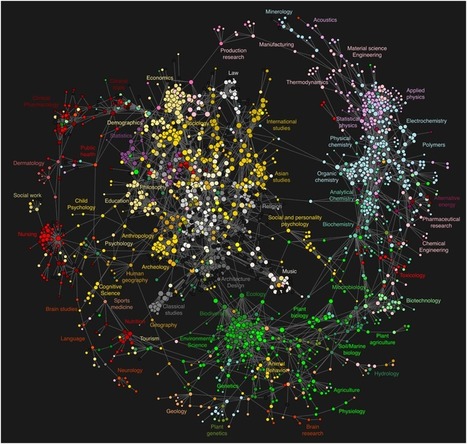
'Maps of science derived from citation data visualize the relationships among scholarly publications or disciplines. They are valuable instruments for exploring the structure and evolution of scholarly activity. Much like early world charts, these maps of science provide an overall visual perspective of science as well as a reference system that stimulates further exploration. However, these maps are also significantly biased due to the nature of the citation data from which they are derived: existing citation databases overrepresent the natural sciences; substantial delays typical of journal publication yield insights in science past, not present; and connections between scientific disciplines are tracked in a manner that ignores informal cross-fertilization..' Via Nicholas Goubert, Lauren Moss, Rui Guimarães Lima, luiy
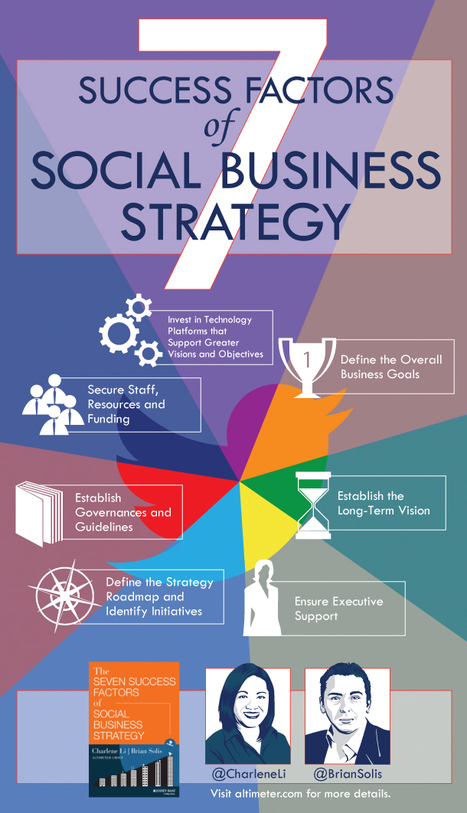
Over the years, we studied businesses endeavoring to master social media at various stages.
Visit the link to view 3 different visual interpretations of the 7 Success Factors of Social Business Strategy… Via Lauren Moss, Charles Mungai, Jesús Hernández

Mike Gingerich's curator insight,
October 8, 2013 8:51 AM
"You can't align your social strategy with your business objectives if you don't even know what your objectives are." - Mark Smiciklas

chen kc's curator insight,
October 10, 2013 12:35 AM
http://www.staged.com/video?v=WQce like this video content...i like this....great visualise...
![How to Make the Most of Big Data [Infographic] | E-Learning-Inclusivo (Mashup) | Scoop.it](https://img.scoop.it/rMM4-Cdz_nin8tvtKzd3STl72eJkfbmt4t8yenImKBVvK0kTmF0xjctABnaLJIm9)
Big Data has become an essential part of the world of business, providing billions of data points from targeted audiences globally. Data points are comprised of the market intelligence that have been gathered into consumer behavior, purchasing patterns and brand affinity across numerous verticals from auto, tech, gaming, health and beauty, entertainment, and travel, among others. The customer intelligence derived from actionable data helps identify markets and customers, measure brand loyalty and pinpoint new trends; ultimately, helping companies understand what people think.
Big data doesn’t come from one source, but from a multitude of sources – surveys, focus groups, mobile feedback, purchase history and customer service to name a few... Via Lauren Moss, Alessandro Rea
|
Beth Dichter's curator insight,
February 25, 2015 10:45 AM
This infographic is one resource found at this site, which also provides a detailed planning guide for Deeper Learning. Click through to the site and you will find a section on: * The DL Learning Guide which provides a series of exercises and a set of resources that demonstrate how you can create conditions necessary for Deeper Learning. * The User Guide an overview and framework. You will also find a Table of Contents. * You can access each phase from this section or you can move to the section called DL Phases. Phase 1 helps you Establish a Vision for Students. Phase 2 focuses on Understanding and Assessing the Conditions for Deeper Learning. Phase 3 guides you on Planning for Deeper Learning. Phase 4 is on Monitoring Your Plan for Deeper Learning. If your district or school is considering Deeper Learning this is a great resource to share, or to create a focus group to explore the concept and decide if it is the right time for your building.

" Nowadays, it's less about putting pen to paper and more about turning on your laptop. But are we losing about by letting the art of penmanship die?" Via Beth Dichter
Beth Dichter's curator insight,
February 21, 2015 6:24 AM
Cursive writing? Should we teach it or not? Many states are still requiring cursive writing be taught, but it is not part of the Common Core. This infographic provides information about why it is important that students learn cursive. 
Bart van Maanen's curator insight,
February 21, 2015 10:17 AM
Uit onderzoek is gebleken dat leerlingen lesstof beter opnemen als ze handgeschreven notities maken. Gewoon leren schrijven en het ontwikkelen van je handschrift blijft dus van groot belang.
Beth Dichter's curator insight,
November 28, 2014 8:58 PM
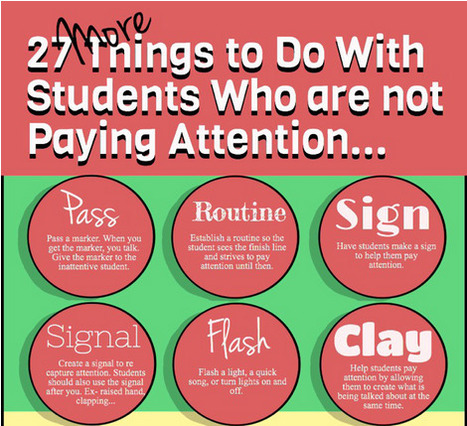
Check out this new infographic from Mia MacMeekin that provides 27 tips on ways you might work with students who are not paying attention. Some of these suggestions may be new to you. Consider sharing this with teachers at your school and beyond!
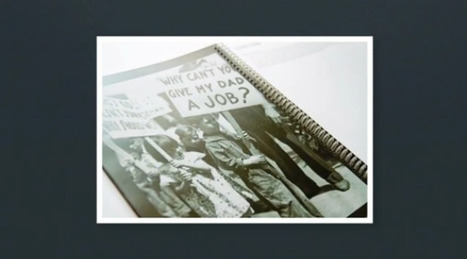
"The expanded availability of easy tech tools has empowered educators to rethink homework and daily instruction. Flipping the classroom with teacher-made videos allows students to self-direct their at-home learning. Many of these clips, however, still involve a one-day delivery of information, from teacher to student. Another approach is to allow children to make their own educational videos. They can enlighten their classmates with their creations, and they can teach themselves the material and the skills during the process of production." Via Beth Dichter
Beth Dichter's curator insight,
May 26, 2014 8:47 PM
Have you considered having students use the Adobe Voice app (iPad) to create materials that others may use to review work? This post shares how one school has done this with 8th grade students and provides 3 videos embedded in the post as well as a link to a page where you can see more student work. The post also discussed "four key proficiencies" that students may demonstrate as they create an Adobe Voice video: * Symbolic and visual metaphor - in choosing images and/or icons and their definitions of words students are demonstrating understanding of figurative meaning. * Narrative - students narrate their story and provide images that seamlessly move from one point to another within the story. * Text- students select key text, highlighting vocabulary. * Design - students learn critical elements necessary to convey content. Elements may include, music, images, voice, color, transitions, layout and more.

Starting out in data visualization can be a difficult thing to do. Heres what you need to know.
"At its simplest, a flipped format can involve a teacher inviting students to view YouTube videos at home as a preview to the day's topic. At its most rigorous, a flipped curriculum involves teachers writing, producing, directing, editing, and posting their own original lessons -- complete with custom narrations and visualizations -- via third-party applications." Via Beth Dichter, Alfredo Calderón

Ness Crouch's curator insight,
March 29, 2014 5:13 PM
These motion infographics look interesting. I wonder if I can find content for my class? 
Jeongbae Kong Enanum's curator insight,
August 16, 2014 9:48 AM
Won Ho :<생각이 깊은 교수님의 글이라서 연구해봐야겠다.> Why should the video watching previous to in-class? The core is quality video access and intensive in-class interaction. The lecture can't complete with these superb ones. 꼭 뒤집어야만 하는가? 내게 플립러닝의 핵심은 수준 높은 비디오와 강력한 상호작용이다. 순서와 방식은 여러 가지가 가능하다. 선생님이 개념 설명 행위는 여기 비디오를 보면 조만간 사라질 게 당연해 보인다.

María Dolores Díaz Noguera's curator insight,
February 4, 2016 7:39 AM
Flipping The Flipped Classroom - Motion Infographics For STEM Learning | @scoopit via @BethDichter http://sco.lt/...
During the past few years the demand regarding Data Info-graphics has increased in volume and demand as well as in clarity. The range of technologies available by which to collect and examine data is constantly on the rise- both in web and desktop applications, which provide several great interfaces. Within this scope, such new tools are continually emerging whose main purpose is to- simplify the process within being able to harness data in lending impact and insight generation... Via ghbrett, Lauren Moss, michel verstrepen, ThePinkSalmon
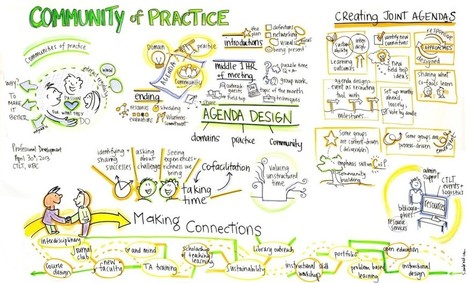
Visual summary of discussion by facilitators of Community of Practice at UBC, graphic recording, How does this relate to agenda design? You can design content and structures that support Community of Practice principles ... Via Petra Hegenbart, Jose Luis Anzizar

Petra Hegenbart's curator insight,
May 31, 2013 6:32 AM
“Communities of practice are groups of people who share a concern or a passion for something they do and learn how to do it better as they interact regularly.” This actually describes the ideal for teams in a corporate context as well. You can design content and structures that keep participants engaged and motivated by using Visual Facilitation or Graphic Recording.
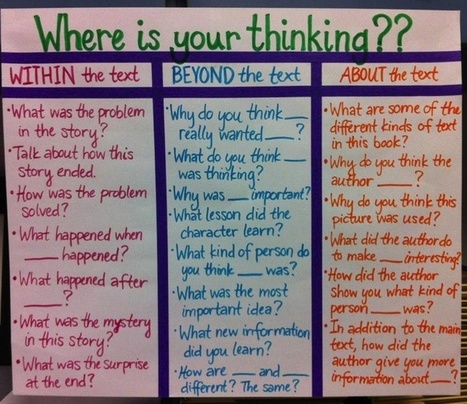
"The Common Core Standards represent a shift in the traditional instruction of English-Language Arts in the average American public school K-12 classroom. While there are several differences in the new standards, one of the most interesting (in addition to the expectation of technology integration) is the trend from literary to non-fiction texts." Via Beth Dichter, Ricard Lloria
Beth Dichter's curator insight,
August 1, 2013 7:05 PM
This could be used as a great anchor chart for students to see when when reading text and preparing to respond to the text. Although the title says 20 questions I count 21 questions on this visual, questions that are require critical thinking skills, questions that may be used with a variety of texts (as required by Common Core). The questions are in three categories (information below quoted from the article): * Within the text - summaries, sequence of events, conflict/resolution, etc * Beyond the text - Inferencing, implicit ideas, evaluation, etc. * About the text - Author purpose, author style, characterization, etc. The post also relates the areas to Bloom's Taxonomy. You might also look at the question relative to Depth of Knowledge. |