

Via luiy
Get Started for FREE
Sign up with Facebook Sign up with X
I don't have a Facebook or a X account


 Your new post is loading...
 Your new post is loading...
Your new post is loading...


Claudia Estrada's curator insight,
March 4, 2014 8:59 AM
Writing doesn´t have to be a tedious process and we can enhance it with some tools. It might develop some creativity too! 
Alfredo Corell's curator insight,
March 23, 2014 12:49 PM
Using comic strips is one powerful way to get students excited and motivated about the writing act. Students love to interact with visuals and tools such as the ones listed below will empower them to do just that. Using these comic strip generators , students will get to engage in conversations using cartoonic characters and build stories and share their works with each other. 
Ness Crouch's curator insight,
March 28, 2014 7:45 PM
I like these ideas! Teaching comic strip writing can be lots of fun!
Welcome to a new series of short posts. These posts will be short, timely, and will come between my weekly longer in-depth posts. Please sign up for 21centuryedtech by email or RSS to follow all e...
A free HTML5 app to take the pain out of transcribing interviews. Useful for journalists, academics and anyone else transcribing audio. And it's open source, too. Via Nik Peachey, Jon Altuna

Emma Lozano's curator insight,
February 10, 2014 2:47 PM
Herramienta para transcribir vídeos y audio. 
Aguilar Dominique's curator insight,
February 26, 2014 1:28 PM
Indispensable et fabuleux pour faciliter les interviews . Les plans de relève lors de départs en retraite s'en trouvent facilités.

Need a tool that wraps up content curation, social sharing and social analytics? Read this in-depth comparison to see how Scoop.it and Swayy compare. Via Peg Corwin, Елена Гончарова, Vladimir Kukharenko

Peg Corwin's curator insight,
September 9, 2013 10:20 AM
See comparison of these two CONTENT CURATION platforms. Quote: "Scoop.it wins on the sheer number of places you can share content to, but I love the hashtag and mention suggestions in Swayy." If you like this scoop, please consider a thumbs up or share.
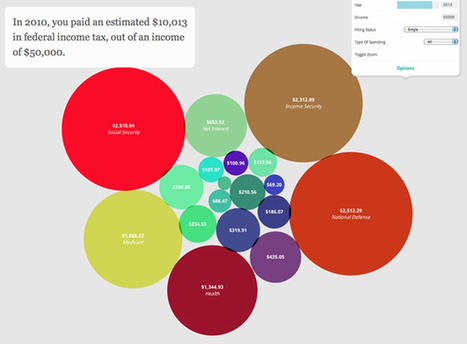
During the past few years the demand regarding Data Info-graphics has increased in volume and demand as well as in clarity. The range of technologies available by which to collect and examine data is constantly on the rise- both in web and desktop applications, which provide several great interfaces. Within this scope, such new tools are continually emerging whose main purpose is to- simplify the process within being able to harness data in lending impact and insight generation... Via ghbrett, Lauren Moss, michel verstrepen, ThePinkSalmon

An online portfolio can help you land clients while building your brand and network. Here are 20 platforms to help you get it right. Via Dr. Susan Bainbridge, Elke Höfler
Social Media tools can greatly enhance students creativity. It also facilitates teachers to easily engage students in interaction environment. Here're the free online tools that can be used for educators. Via Dr. Susan Bainbridge
Alfredo Corell's curator insight,
September 8, 2013 11:41 AM
Internet can be used as the best classroom for students and teachers, where we've tons of facilities to take the advantages from, to enhance the students capabilities and to facilitate the teachers, There're social media tools to use and get educators into interaction environment. 
María Asunción Martínez Mayoral's curator insight,
September 11, 2013 4:29 AM
Una guía muy interesante!

Discover 30 useful (and free) eLearning tools and resources that can make your life easier! Via Patty Ball, Timo Ilomäki

Holly Dilatush's comment,
June 7, 2013 12:31 PM
Thanks for sharing this and so many other worthwhile links, Patty

Roberto Ibán Ramírez Avila's curator insight,
June 18, 2013 2:09 PM
Al revisar este artículo, me topé con la sorpresa y novedad que de las treinta herramienats mencioandas, de ellas pude descargar un manual sobre elearning que me va a servir para orientar con mayor precisión y eficiencia el proceso de diseño instruccional para la creación de cursos mixtos o en línea.

Biteslide is a fun and easy-to-use slidebook app that promotes student creativity, self-expression, and imagination. Via Dr. Susan Bainbridge

PDC 3.0 es un programa que proporciona un sistema ágil, rápido y sencillo para la planificación y el desarrollo de Programaciones Didácticas y Unidades Didácticas basadas en Competencias Básicas. Dispone de distintos sistemas de evaluación y permite generar en cualquier momento un informe de cada alumno recogiendo aquellos aspectos en los que es competente y aquellos en los que no. También incluye la posibilidad de crear adaptaciones curriculares y PTIs. Via Pilar Pamblanco, Ramon Aragon, Mariano Fernandez S., LGA

Aprendiendo juntos's curator insight,
February 11, 2013 5:12 AM
Herramienta para unidades didácticas..habrá que echarle un vistazo¡

The Floe Inclusive Learning Design Handbook is a free Open Educational Resource (OER) designed to assist teachers, content creators, Web developers, and others in creating adaptable and personalizable educational resources that can accommodate a diversity of learning styles and individual needs. Via Dr. Susan Bainbridge, Adelina Silva

Angela C. Dowd's comment,
February 25, 2013 11:58 AM
Floe stands for Flexible Learning for Open Education. Accessible design benefits everyone.

Klara Somogyi's curator insight,
August 20, 2013 11:12 AM
guidelines for creating accessible content |
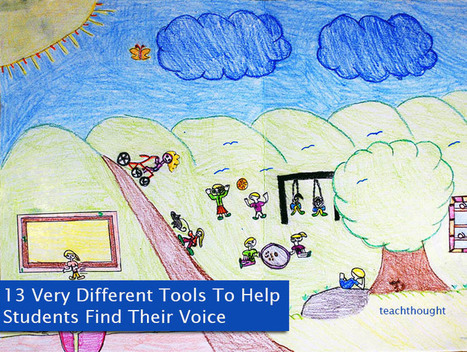
""Students need a voice. By voice, I mean the ability to recognize their own beliefs, practice articulating them in a variety of forms, and then find the confidence — and the platform — to express them." Via Beth Dichter, Bhushan Thapliyal, Ana Lara

Chris Carter's comment,
May 3, 2014 7:55 PM
I appreciate the breadth of options suggested here. This is not, "just use tech!"

Monica S Mcfeeters's curator insight,
May 4, 2014 10:06 PM
A very important reason to use media tools is to give a voice to everyone, even little ones!

luiy's curator insight,
March 16, 2014 6:36 AM
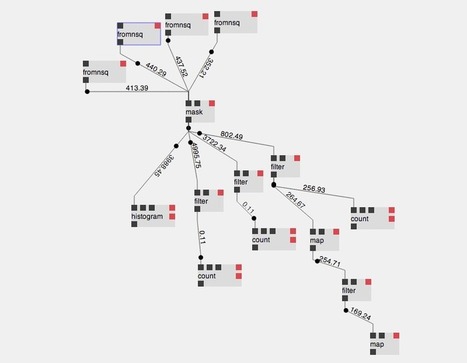
INTRODUCING STREAMTOOLS: A GRAPHICAL TOOL FOR WORKING WITH STREAMS OF DATA
New and open source from the New York Times R&D Lab.
We see a moment coming when the collection of endless streams of data is commonplace. As this transition accelerates it is becoming increasingly apparent that our existing toolset for dealing with streams of data is lacking. Over the last 20 years we have invested heavily in tools that deal with tabulated data, from Excel, MySQL, and MATLAB to Hadoop, R, and Python+Numpy. These tools, when faced with a stream of never-ending data, fall short and diminish our creative potential.
In response to this shortfall we have created streamtools—a new, open source project by the New York Times R&D Lab which provides a general purpose, graphical tool for dealing with streams of data. It offers a vocabulary of operations that can be connected together to create live data processing systems without the need for programming or complicated infrastructure. These systems are assembled using a visual interface that affords both immediate understanding and live manipulation of the system.

Mlik Sahib's curator insight,
March 17, 2014 11:09 PM
"In response to this shortfall we have created streamtools—a new, open source project by the New York Times R&D Lab which provides a general purpose, graphical tool for dealing with streams of data. It offers a vocabulary of operations that can be connected together to create live data processing systems without the need for programming or complicated infrastructure. These systems are assembled using a visual interface that affords both immediate understanding and live manipulation of the system."

From
hbr

Fast-changing markets demand rapid development of new products and processes. Thousands of tools and methods are available to help innovators discover what users want and how to deliver on their expectations. The challenge is to figure out which ones to use when.
Luma Institute has created a framework to help you choose the best tool for each step of the innovation process, based on the people you’re designing for and the complexity of the systems in which you operate. Luma distilled the portfolio down to 36 of the most effective tools for innovation—the majority of them in common use—organized in three categories: looking, understanding, andmaking. Each category contains three subcategories, and each subcategory contains four innovation tools. This hierarchical model makes it much easier to identify the tools you need and then put them to use.

Una URL que representa tu perfil educativo. Comparte tu Entorno Personal de Aprendizaje (PLE), conecta con otros docentes, integra tu perfil docente en redes sociales, blogs...
Create Sophisticated Unique Digital Learning Content With Ease Using This Powerful Free Multimedia Tool What Is Metta? Metta (www.metta.io) is a digital
Social Media tools can greatly enhance students creativity. It also facilitates teachers to easily engage students in interaction environment. Here're the free online tools that can be used for educators. Via Dr. Susan Bainbridge, Ivo Nový
Alfredo Corell's curator insight,
September 8, 2013 11:41 AM
Internet can be used as the best classroom for students and teachers, where we've tons of facilities to take the advantages from, to enhance the students capabilities and to facilitate the teachers, There're social media tools to use and get educators into interaction environment.
María Asunción Martínez Mayoral's curator insight,
September 11, 2013 4:29 AM
Una guía muy interesante!

"Here is a comprehensive list of some very good tools for making infographics. The list features more than 40 applications so you have a wide variety of options to choose from.While some of these tools are pretty basic and you can use them without any complications, others do require some advanced tech knowledge and design know-how..."

Join the worldwide community of educators who are passionate about ensuring learners are prepared to thrive in the global economy. Via xavier suñé
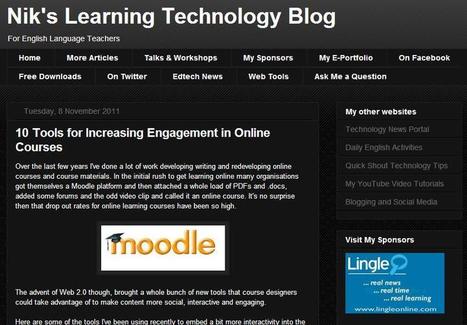
From Nik Peachey Via Nik Peachey, Suzanne, chadjwilliams, Julien Hering, PhD, Juan Alberto L Uribe, LaiaJoana, THE OFFICIAL ANDREASCY, Rui Guimarães Lima

Eli's curator insight,
February 27, 2013 6:10 PM
Engagement is SO critical to learning, retention and productivity 
Isabel zamora's curator insight,
February 25, 2020 7:41 AM
I found this interesting since you as an online teacher need to be creative and these tools help you a lot. Goanimate its an easy tool for creating short animated dialogues making the course fun. There are a lot of things here that can help you to be interactive into the courses.
|


Alluvial diagrams are a type of flow diagram that have traditionally been used to visually show changes in network structures over time. Density Design has included Alluvial Diagrams in their RAW online visualization tool and explored its use to show “relations between dimensions of categorical data.”
RAW is such a wonderfully easy tool to use that I wanted to explore the Alluvial diagram functionality with a few different data sets to see how the visualizations would come out.