Help and Support everybody around the world
43.4K views | +3 today
Follow
Help and Support everybody around the world
Making the help and information to every body
Curated by Ricard Lloria
Your new post is loading...
Rescooped by Ricard Lloria from Creative teaching and learning
Scoop.it!

Free Technology for Teachers: Seven good tools for creating and publishing online timelines

Free Technology for Teachers: Seven good tools for creating and publishing online timelines | Help and Support everybody around the world | Scoop.it

"Creating timelines has been a staple in history teachers' playbooks since the beginning of history. Writing a timeline is a good way for students to chronologically summarize sequences of events and see how the events are connected ..."


Via Leona Ungerer
No comment yet.
Rescooped by Ricard Lloria from Learning & Mind & Brain
Scoop.it!

After 100 Years of the Same Teaching Model It’s Time to Throw Out the Playbook

After 100 Years of the Same Teaching Model It’s Time to Throw Out the Playbook | Help and Support everybody around the world | Scoop.it
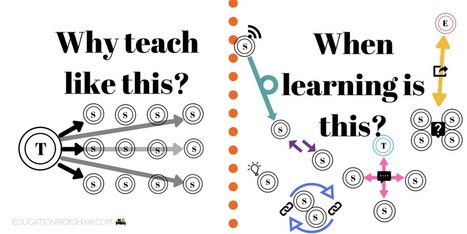
Time to Throw Out the Playbook In looking back at my parents’ education in the 1950s and 60s, and my own education in the 1990s and 2000s, I worry sometimes that despite the huge advances that we’ve seen in technology, not much has changed when it comes to how we view learning and how we design learning environments. The transmission model of education is still the name of the game, although in some circles there are signs of its erosion.

I would like to take you on a journey in this post, starting from the 1950s banking model (Freire, 1968) of instructional design, before comparing it to my own schooling experiences as a digital native at the turn of the century. Then, finally, I would like to share my vision for C21 learning, and propose some ways that we can move forward so that we are meeting the needs of today.

Via Mark E. Deschaine, PhD, Miloš Bajčetić
Presenters's curator insight, January 8, 2018 4:41 AM
Los modelos educativos se han mantenido durante muchos años, pero ¿y si ya no son tan eficaces? ¿Y si es necesario una revisión para mejorar? Este artículo te hará reflexionar sobre estas y otras cuestiones. 
Dr. Theresa Kauffman's curator insight, January 9, 2018 9:28 AM
We must change in order to engage the brains and the way they are wired for the 21st century.
EntreCulturas's curator insight, January 9, 2018 11:20 AM
No se ha visto un cambio mayor en la estructura de las clases Americanas. Este articulo compara la estructura de los años 1950s a el de los 1990 y a los actuales. El problema que identifican es la interacción linear entre profesor y estudiante. El blog tiene mas artículos que elabora las formas en que se pueden organizar las clases, y ayudar que la aula sea dirigida mas por los estudiantes y menos por los profesores. Este articulo elabora sobre la estructura ideal de las clases en el siglo 21: https://educationrickshaw.com/2017/08/02/what-does-a-21st-century-classroom-look-sound-and-feel-like/
Scooped by Ricard Lloria
Scoop.it!

Isaac Asimov Predicts in 1964 What the World Will Look Like Today — in 2014

Isaac Asimov Predicts in 1964 What the World Will Look Like Today — in 2014 | Help and Support everybody around the world | Scoop.it
When New York City hosted The World's Fair in 1964, Isaac Asimov, the prolific sci-fi author and professor of biochemistry at Boston University, took the opportunity to wonder what the world would look like 50 years hence -- assuming the world survived...
No comment yet.
Rescooped by Ricard Lloria from visual data
Scoop.it!

Five of the Most Important Infographics of the 19th Century

Five of the Most Important Infographics of the 19th Century | Help and Support everybody around the world | Scoop.it

Data visualization is not a new phenomenon. For centuries, artists and historians, educators and scientists have been creating illustrations to better communicate complex information.


From Emma Willard’s “Picture of Nations” to Dimitri Mendeleev’s Periodic Table, historical infographics continue to inspire and educate today. Here is a look at some of the most influential and beautiful infographics from the 19th century...


Via Lauren Moss
No comment yet.
Rescooped by Ricard Lloria from Creative teaching and learning
Scoop.it!

New tools for interactive fiction and engaged writing

New tools for interactive fiction and engaged writing | Help and Support everybody around the world | Scoop.it

"An interactive storytelling tool called Twine hooks students into deeper learning through the empathy of creating a choice-filled historical narrative with multiple outcomes ..."


Via Leona Ungerer
No comment yet.
Rescooped by Ricard Lloria from E-Learning-Inclusivo (Mashup)
Scoop.it!

Eight web tools for creating multimedia timelines

Eight web tools for creating multimedia timelines | Help and Support everybody around the world | Scoop.it

"As the New Year approaches we often reflect on the past year to set new goals. One way for learners to reflect on the past is by creating a personal timeline of the important events of the past year ..."

©


Via Leona Ungerer, juandoming
Isik Cigdem's curator insight, December 17, 2017 5:52 PM
DocBiodiv's curator insight, December 19, 2017 5:41 AM
A la fin de l'article un calendrier de l'avent qui présente un outil/jour, une bonne idée !
Rescooped by Ricard Lloria from Eclectic Technology
Scoop.it!

An infographic timeline of timelines and infographics | Visual.ly

An infographic timeline of timelines and infographics | Visual.ly | Help and Support everybody around the world | Scoop.it

Via Beth Dichter
Beth Dichter's curator insight, August 3, 2013 10:22 PM

If you were to ask your students when infographics were first created what do you think their answer would be? What would your answer be? This infographic looks at "a timeline of timelines and infographics" and the result may surprise your students. It would be a good to use as an introduction to infographics along with the one that was put out using Legos to answer the question "What is an infographic?" located at

http://visual.ly/what-infographic-2.