


Research and publish the best content.
Get Started for FREE
Sign up with Facebook Sign up with X
I don't have a Facebook or a X account
Already have an account: Login

Help and Support everybody around the world
43.4K views |
+3 today

Making the help and information to every body
Curated by
Ricard Lloria
 Your new post is loading...
 Your new post is loading...
Your new post is loading...
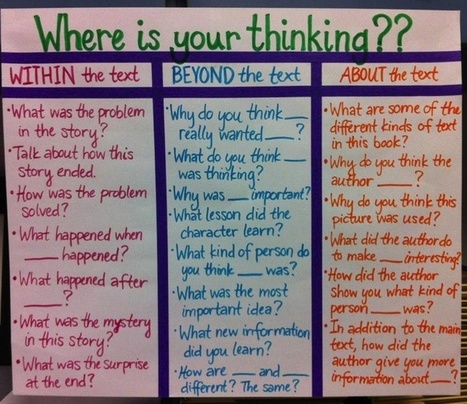
"The Common Core Standards represent a shift in the traditional instruction of English-Language Arts in the average American public school K-12 classroom. While there are several differences in the new standards, one of the most interesting (in addition to the expectation of technology integration) is the trend from literary to non-fiction texts." Via Beth Dichter 

Beth Dichter's curator insight,
August 1, 2013 7:05 PM
This could be used as a great anchor chart for students to see when when reading text and preparing to respond to the text. Although the title says 20 questions I count 21 questions on this visual, questions that are require critical thinking skills, questions that may be used with a variety of texts (as required by Common Core). The questions are in three categories (information below quoted from the article): * Within the text - summaries, sequence of events, conflict/resolution, etc * Beyond the text - Inferencing, implicit ideas, evaluation, etc. * About the text - Author purpose, author style, characterization, etc. The post also relates the areas to Bloom's Taxonomy. You might also look at the question relative to Depth of Knowledge.
![World Supplies of Non-Renewable Resources, Visualized [Environmental Infographic] | Help and Support everybody around the world | Scoop.it](https://img.scoop.it/y_fy5mV9xF1s1xAJ39O8ijl72eJkfbmt4t8yenImKBVvK0kTmF0xjctABnaLJIm9)
Politicians and oil companies might waste time debating whether or not we’ve reached peak oil. What they ignore is that we run out completely in under 40 years’ time, by which time a third of the planet’s biodiversity will be lost. In the meantime, tantalum, that great mainstay of mobile telecoms, will last only a few years more and run out just in time to celebrate the planet breaking the 2oC barrier in 2060. Via Lauren Moss
|
Beth Dichter's curator insight,
August 3, 2013 10:22 PM
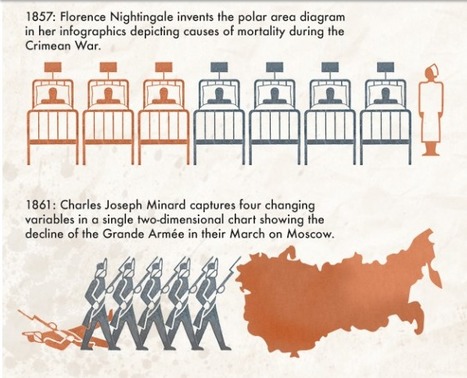
If you were to ask your students when infographics were first created what do you think their answer would be? What would your answer be? This infographic looks at "a timeline of timelines and infographics" and the result may surprise your students. It would be a good to use as an introduction to infographics along with the one that was put out using Legos to answer the question "What is an infographic?" located at
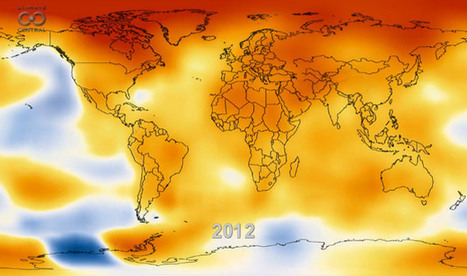
An amazing 13-second NASA animation depicting how the globe has warmed during the period of 1950 to 2012. From our friends at NASA comes this amazing 13-second animation that depicts how temperatures around the globe have warmed since 1950. You’ll note an acceleration of the temperature trend in the late 1970s as greenhouse gas emissions from energy production increased worldwide and clean air laws reduced emissions of pollutants that had a cooling effect on the climate, and thus were masking some of the global warming signal.
The data come from NASA's Goddard Institute for Space Studies in New York (GISS), which monitors global surface temperatures. As NASA notes, “All 10 of the warmest years in the GISS analysis have occurred since 1998, continuing a trend of temperatures well above the mid-20th century average. Via Lauren Moss
![Smart Grid – Where Power is Going [infographic] | Help and Support everybody around the world | Scoop.it](https://img.scoop.it/dylR2gPuxwkwSCw0lKarazl72eJkfbmt4t8yenImKBVvK0kTmF0xjctABnaLJIm9)
Why should an everyday homeowner care that the smart grid can increase the U.S. electric grid's efficiency by 9 percent? And what does that amount to in terms of energy and monetary savings? This infographic visually highlights those savings and what they actually mean to consumers.
The effort aims to connect the consumer with the smart grid, by explaining it simply and driving home the many benefits of smart grid technology, including: cost savings, energy efficiency, improved outage detection and resolution, as well as environmental benefits,. “By highlighting the conveniences and benefits the smart grid can bring to consumers, the SGCC and its members can help consumers understand the smart grid just as they understand other, consumer-friendly, ‘smart’ technologies they wouldn’t consider living without – such as a smart phone, computer or television.” Via Lauren Moss
|


Giocando....s'impara!
Please teacher, more games!
Self explanatory visual on the benefits of gaming as a means of learning. Outlined are the rewards, mastery, engagement, intensity, exercise, readiness, and competitiveness. These types of graphics need to be displayed in the classroom. There's always parents who are unsure of how gaming qualifies as teaching. Can't they just sit their kid in front of an iPad all day at home? Well, in the appropriate setting, with the right direction and guidance, games are certainly good for learning. Some people just don't know that from experience yet.