We asked Randy Krum, Founder and President of InfoNewt, an infographic
design company, and editor of the Cool Infographics website, to share some
of his insights from working with and reviewing infographics.
Via Martin (Marty) Smith
Get Started for FREE
Sign up with Facebook Sign up with X
I don't have a Facebook or a X account
Scooped by Brian Yanish - MarketingHits.com from Must Design |
We asked Randy Krum, Founder and President of InfoNewt, an infographic
design company, and editor of the Cool Infographics website, to share some
of his insights from working with and reviewing infographics.
Scooped by Brian Yanish - MarketingHits.com |
Infographics blog covering infographics, data visualization and visual thinking. Charts and graphs communicate data, infographics turn data into information.
Scooped by Brian Yanish - MarketingHits.com from visual data |
Belgian studio Coming Soon is all about making it big. Their Hand Lettering creations filled a giant chalkboard with letters in a variety of fonts and styles. And with Infographics XXXL, they’ve taken actual graphs and blown them up to a huge size for a client that specializes in the research of nanobodies.
The result is that, instead of casually glancing at the same old pie chart or bar graph, shareholders have something to keep their gaze on the numbers, like a blurry scientist walking by human-size bars or holding up a literal piece of the pie.
See a selection of Coming Soon’s giant infographics at the article link.
Scooped by Brian Yanish - MarketingHits.com from visual data |
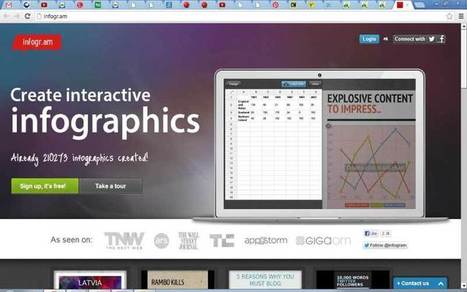
Want to create an attractive infographic but don’t have the budget to hire a professional designer?
Then you should try using an infographic-creation tool.
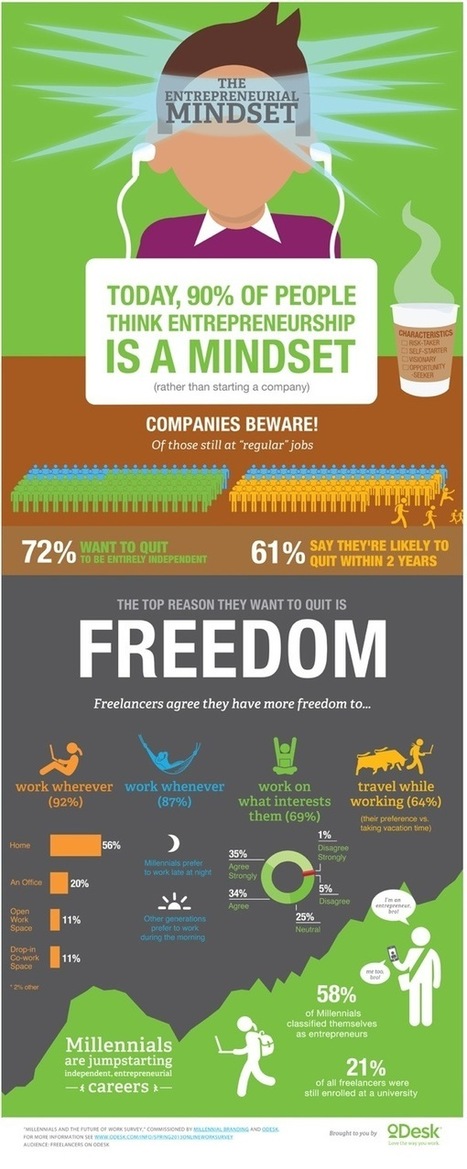
If your small business is looking for an eye-catching and easy to comprehend way to teach, inform, and inspire others about its products and services, infographics might be a good solution. Infographics can be more effective and memorable than other ways to present data, making them particularly effective for online audiences.
To create an infographic, you should make a list of possible ideas that you want to get across, create the initial draft or skeleton, color scheme it, and research your content from authoritative sites. Then it’s time to select your design platform.
Read about three online tools that can help you create stunning infographics...
Don't be fooled by infographic naysayers. Yes there are BAD infographics, yet when I tracked the top 10 for my 125,000 views on Scoopit Infographics owned more than half of almost every feed's top 10. Translation - we need to create infographics and other forms of data visualization.
Here are 3 great tips from an Infographic design pro:
* Keep It Clear.
* Be Iconic.
* Know the rules.
Come to think of it those tips apply to pretty much anything we lucky few Internet marketers do :). M
www.aanve.com
If 8 tips weren't enough, here are 3 more.